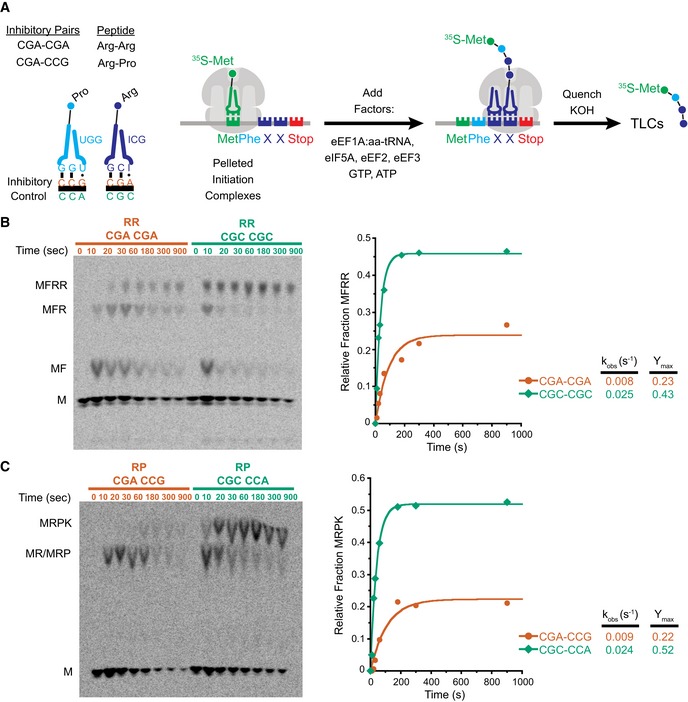
Figure 1. Inhibitory codon pairs slow elongation in vitro .

- Inhibitory pairs showing the inhibitory mRNA codons (red) and the optimal codons (green). Schematic representation of the in vitro elongation reactions performed using the reconstituted yeast translation system. Pelleted 80S initiation complexes (3 nM) are incubated with aminoacyl‐tRNAs (15–25 nM), elongation factors (1 μM), GTP, and ATP. Reactions are quenched with KOH and the products resolved by electrophoretic TLCs.
- Representative eTLCs (left) and corresponding elongation kinetics (right) for the CGA–CGA inhibitory pair (red) and the CGC optimal pair (green). Product formation is normalized to the fraction of Met ICs that form Met–Puro when reacted with puromycin (Fig EV1A).
- Representative eTLCs (left) and corresponding elongation kinetics (right) for the CGA–CCG inhibitory pair (red) and the CGC–CCA optimal pair (green). Product formation is normalized to the fraction of Met ICs that form Met–Puro when reacted with puromycin (Fig EV1A).
