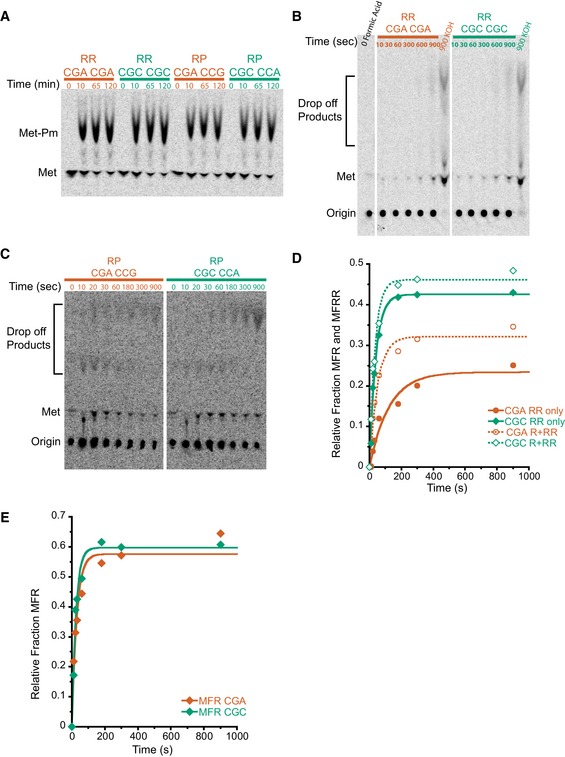
Figure EV1. Initiation complex test of Met–Pm activity and individual product analysis of MFRR elongation.

- Met–Pm activity for all the ICs formed with WT ribosomes on inhibitory mRNAs (red) and optimal mRNAs (green). There is no significant difference in activity at the last time point for any of the ICs.
- TLC showing peptidyl‐tRNA drop‐off using the PTH assay on MFRR ICs with the inhibitory (CGA–CGA) pair (red) and the optimal (CGC–CGC) pair (green). Time points were quenched with formic acid to assess drop‐off, and time points quenched with KOH were to monitor peptide formation as a control. There is no significant accumulation of peptidyl‐tRNA drop‐off products.
- TLC showing peptidyl‐tRNA drop‐off using the PTH assay on MRPK ICs with the inhibitory (CGA–CCG) pair (red) and the optimal (CGC–CCA) pair (green). Time points were quenched with formic acid to assess drop‐off. There is no significant accumulation of peptidyl‐tRNA drop‐off products.
- Elongation kinetics for the MFR and MFRR products together versus the final MFRR product alone for the inhibitory (CGA–CGA) pair (red) and the optimal (CGC–CGC) pair (green). The increased rate and amount of product formed for the MFR and MFRR data compared to the MFRR alone suggest that the addition of the second arginine is slower than the first.
- Elongation kinetics for the addition of a single arginine on an MFR (CGA) message in red and MFR (CGC) message in green. The addition of the first arginine is similar for CGA and CGC, again suggesting that the addition of the second arginine is the slower step.
