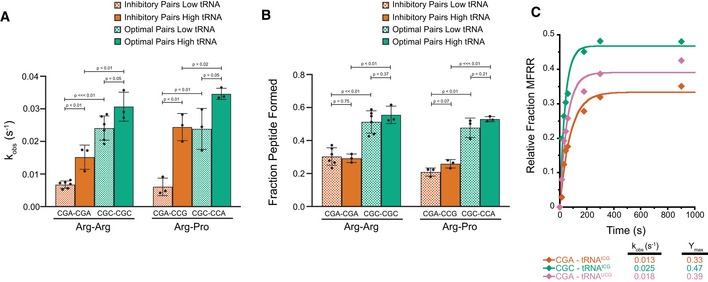
Comparison of observed rates of elongation for inhibitory pairs (red) and their optimal controls (green) at limiting tRNA concentrations (hatched bars, 15–25 nM aa‐tRNA) and saturating tRNA concentrations (solid bars, 150–250 nM aa‐tRNA).
Comparison of total peptide formation for inhibitory pairs (red) and their optimal controls (green) at limiting tRNA concentrations (hatched bars, 15–25 nM aa‐tRNA) and saturating tRNA concentrations (solid bars, 150–250 nM aa‐tRNA).
Elongation kinetics for the CGA–CGA inhibitory codon pair with the native arginine ICGtRNA (red) or the non‐native arginine UCGtRNA (pink) and for the CGC–CGC optimal control pair with the native arginine ICGtRNA (green).
Data information: In (A and B), error bars represent standard deviations calculated from at least three experimental replicates (exact number of replicates indicated by the number of dots for each bar plotting the mean for the data).
P‐values calculated using Student's
t‐test and rounded to two decimal places.

