-
A
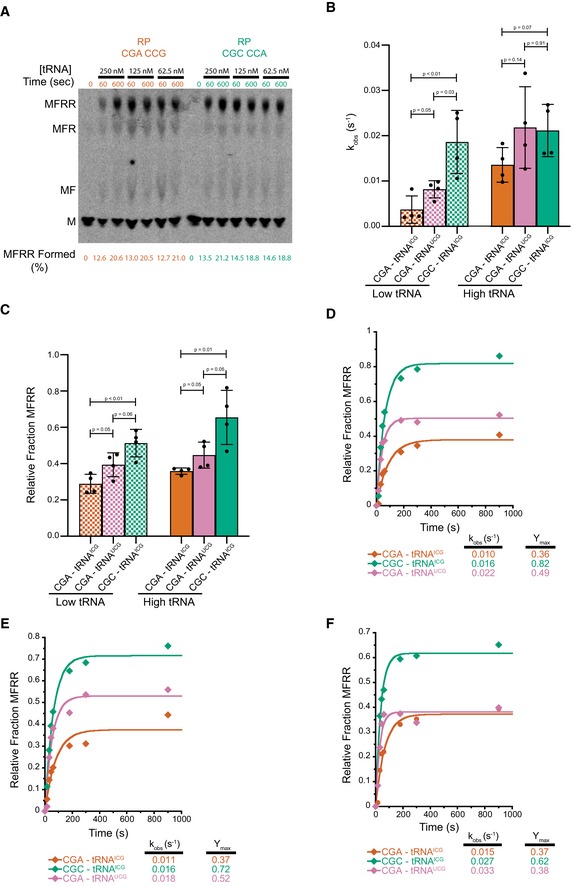
Titration of aa‐tRNA to establish high concentration as saturating for elongation experiments. With this system, it is difficult to increase tRNA concentration, but going only twofold lower in concentration, we do not see differences in the amount of full‐length MFRR product being formed at early (60 s) time points as shown by the quantification below the TLC.
-
B
Comparison of observed rates of elongation for inhibitory CGA–CGA codon pair decoded by the native arginine ICGtRNA (red), inhibitory CGA–CGA codon pair decoded by the non‐natural arginine UCGtRNA (pink), and the optimal CGC–CGC codon pair decoded by the native arginine ICGtRNA (green). Data from experiments performed with limiting tRNA concentrations shown in hatched bars (25 nM aa‐tRNA) and saturating tRNA concentrations in solid bars (250 nM aa‐tRNA). Error bars represent standard deviations calculated from at least three experimental replicates (exact number of replicates indicated by the number of dots for each bar plotting the mean for the data). P‐values calculated using Student's t‐test and rounded to two decimal places.
-
C
Comparison of observed endpoints for inhibitory CGA–CGA codon pair decoded by the native arginine ICGtRNA (red), inhibitory CGA–CGA codon pair decoded by the non‐natural arginine UCGtRNA (pink), and the optimal CGC–CGC codon pair decoded by the native arginine ICGtRNA (green). Data from experiments performed with limiting tRNA concentrations shown in hatched bars (25 nM aa‐tRNA) and saturating tRNA concentrations in solid bars (250 nM aa‐tRNA). Error bars represent standard deviations calculated from at least three experimental replicates (exact number of replicates indicated by the number of dots for each bar plotting the mean for the data). P‐values calculated using Student's t‐test and rounded to two decimal places.
-
D–F
Elongation kinetics for the CGA–CGA inhibitory codon pair with the native arginine ICGtRNA (red) or the non‐native arginine UCGtRNA (pink) and for the CGC–CGC optimal control pair with the native arginine ICGtRNA (green) for the three other replicate experiments used to calculate the averages in (B and C).

