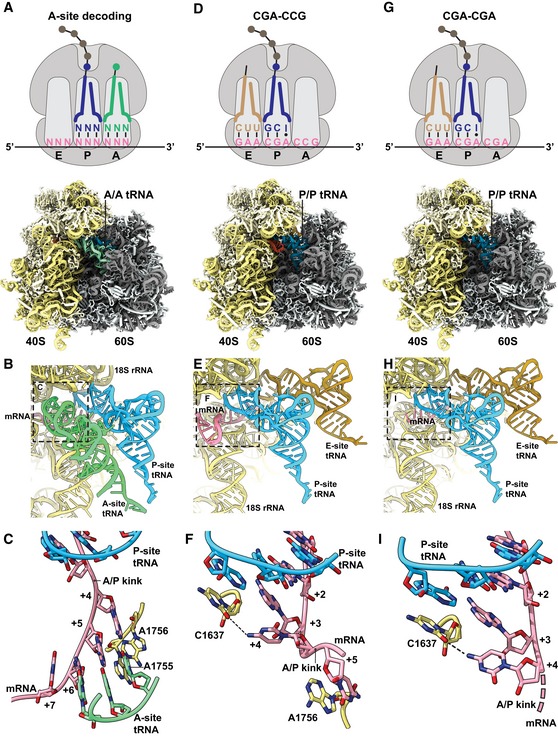
Figure 4. CGA–CCG and CGA–CGA induce stalling through decoding‐incompatible mRNA conformations in the A site.

-
A–CCryo‐EM structural characterization of the pre‐state 80S RNC with A‐site tRNA in the decoding center. (A) Schematic representation of the decoding situation (top) and molecular model for the pre‐state RNC with A‐site tRNA in the decoding center. (B) General overview of the A, P, and E sites with A/A and P/P tRNAs and mRNA. (C) Detailed view of the mRNA in the A site using stick model with cartoon phosphate backbone representation. The 18S rRNA bases A1755 and A1756 recognize the minor groove of A‐site tRNA–mRNA interaction during tRNA decoding.
-
D–FCryo‐EM structural characterization of the CGA–CCG‐stalled 80S RNC. (D) Schematic representation of the stalling situation (top) and molecular model of the CGA–CCG‐stalled RNC (bottom). (E) General overview of the A, P, and E sites with P/P and E/E tRNAs and mRNA. (F) Detailed view of the mRNA in the A site using stick model with cartoon phosphate backbone representation. The mRNA positions +2 to +5 and their interactions are shown. The C +4 is flipped by approximately 95° degrees toward the wobble A:I base pair in the P site and stabilized by interaction with the C1637 of the 18S rRNA helix 44. The C +5 is stabilized by stacking interaction with the A1756 of the 18S rRNA which normally recognizes the minor groove of A‐site tRNA–mRNA interaction during decoding (C).
-
G–ICryo‐EM structural characterization of the CGA–CGA‐stalled 80S RNC. (G) Schematic representation of the stalling situation (top) and molecular model of the CGA–CGA‐stalled RNC (bottom). (H) General overview of the A, P, and E sites with P/P and E/E tRNAs and mRNA. (I) Detailed view of the mRNA in the A site as in (F). Downstream mRNA is indicated by the dotted line. Note the rotation of the C+4 base compared to the CGA–CCG mRNA.
