
Figure EV4. Cryo‐EM structures of RNCs stalled on inhibitory codon pairs in comparison with the A‐site decoding situation.
-
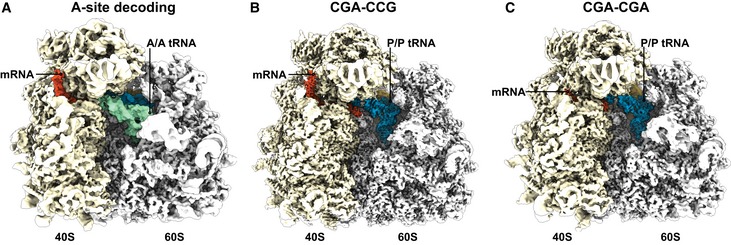
A–CCryo‐EM density maps filtered according to local resolution used to build molecular models. (A) Cryo‐EM map of the pre‐state RNC with tRNA in the A site. (B) Cryo‐EM map of the CGA–CCG‐stalled RNC. (C) Cryo‐EM map of the CGA–CGA‐stalled RNC.