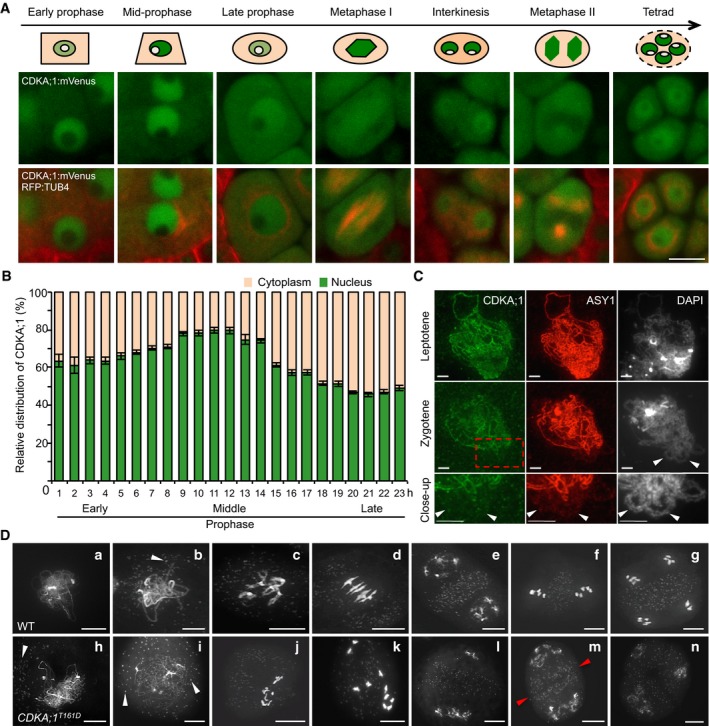
Figure 1. Changes in CDKA;1 distribution and meiotic defects in hypomorphic cdka;1 mutants in male meiocytes.

- Confocal laser scanning micrographs showing the localization of a functional CDKA;1:mVenus fusion protein in the wild type (WT) and cartoons on top highlighting the changes in abundance of CDKA;1:mVenus in the nucleus and cytoplasm during the course of meiosis. The region colored in beige represents the cytoplasm, in green the nucleoplasm, and in white the nucleolus. Scale bar: 10 μm.
- Quantitative analysis of the signal distribution of the nuclear versus cytoplasmic fraction of CDKA;1:mVenus during prophase I of meiosis as revealed by live cell imaging (Movie EV1). Twenty cells at each time point were used for the analysis. Error bars represent mean ± SD, and two biological replicates were performed.
- Immunolocalization of CDKA;1 (green) and ASY1 (red) on spread chromosomes in leptotene and zygotene of wild‐type plants expressing a functional PRO CDKA;1 :CDKA;1:Strep construct. The last lane shows a magnification of the region marked by the red rectangle. Arrowheads indicate synapsed regions of homologous chromosomes where CDKA;1 is no longer present. Scale bar: 5 μm.
- Chromosome spread analysis of the wild type and the hypomorphic cdka;1 mutant CDKA;1 T161D. (a, h) zygotene or zygotene‐like stages; (b, i) pachytene or pachytene‐like stages; (c, j, k) diakinesis or diakinesis‐like stages; (d) metaphase I; (e, i, m, n) end of meiosis I with two (e, m) or three (i) pools of chromosomes; (f) metaphase II; and (g) tetrad. Red arrowheads indicate the initiated formation of a phragmoplast. White arrowheads depict mitochondria. Scale bars: 10 μm.
