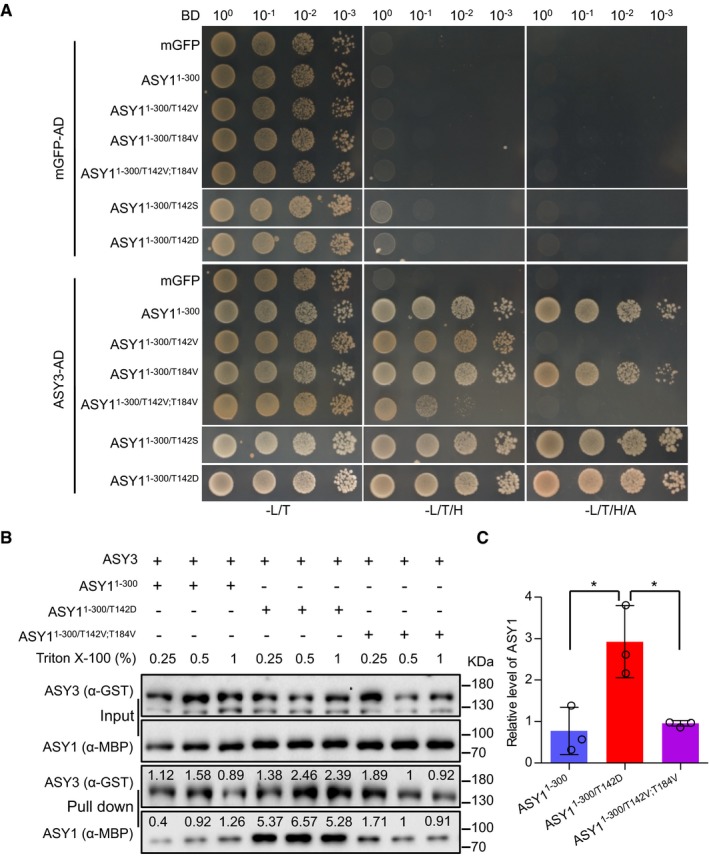
Figure 4. A negative charge at T142 in the HORMA domain of ASY1 promotes its interaction with ASY3.

- Yeast two‐hybrid interaction assays of ASY3 with different ASY1 variants. Monomeric GFP (mGFP) fused with AD (activating domain) and BD (binding domain) were used as controls. Yeast cells harboring both the AD and BD plasmids were grown on synthetic medium supplied with glucose in the absence of Leu and Trp (‐L/T, left panel), on synthetic dropout (SD) medium in the absence of Leu, Trp, and His (‐L/T/H, middle panel), and on SD medium in the absence of Leu, Trp, His and Ade (‐L/T/H/A, right panel). Yeast cells were incubated until OD600 = 1 and then diluted 10‐, 100‐, and 1,000‐fold for the assays.
- GST pull down of ASY3 with different ASY1 variants. The numbers above the bands show the relative intensity of the bands. The input and pull down fractions were analyzed by immuno‐blotting with the anti‐GST (ASY3) and anti‐MBP (ASY1) antibodies.
- Quantification of the pull down fractions of ASY1 as shown in (B). The band intensity in the pull down of ASY11–300/T142V;T184V at a Triton X‐100 concentration of 0.5% was defined as 1. The relative amount of ASY1 in the pull down fractions was normalized by the band intensity of the pulled down ASY3 fraction. The average band intensity of ASY1 at different concentrations of Triton X‐100 used was plotted. Asterisks indicate significant difference (two‐tailed t‐test, P < 0.05). Error bars represent mean ± SD, and two biological replicates were performed.
