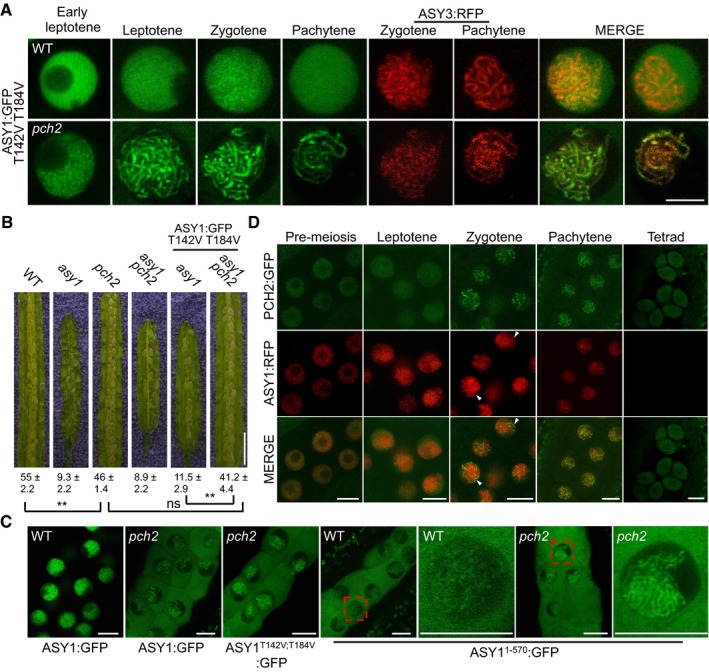
Figure 5. Phosphorylation of ASY1 counteracts the action of PCH2 in early prophase.

- Localization patterns of ASY1T142V;T184V:GFP together with ASY3‐RFP in the wild‐type and pch2 mutants. Please note that images of ASY1T142V;T184V:GFP in pch2 mutants were taken with increased sensitivity for a better visibility. Scale bar: 5 μm.
- Seed sets (mean ± SD, n = 5) of WT, asy1, pch2, asy1 pch2, ASY1 T142V;T184V :GFP (asy1), and ASY1 T142V;T184V :GFP (asy1 pch2) plants. Asterisks indicate significant differences (two‐tailed t‐test, P < 0.01), and ns depicts no significant difference. Scale bar: 2 mm.
- Localization patterns of ASY1:GFP, ASY1T142V;T184V:GFP, and ASY11–570:GFP in the wild‐type (WT) and/or in pch2 mutant plants at early prophase I. Scale bars: 5 μm.
- Localization pattern of PCH2:GFP together with ASY1:RFP in the male meiocytes of wild type. Arrowheads indicate the chromosomal regions where the ASY1 removal was concomitant with the localization of PCH2. Scale bar: 10 μm.
Source data are available online for this figure.
