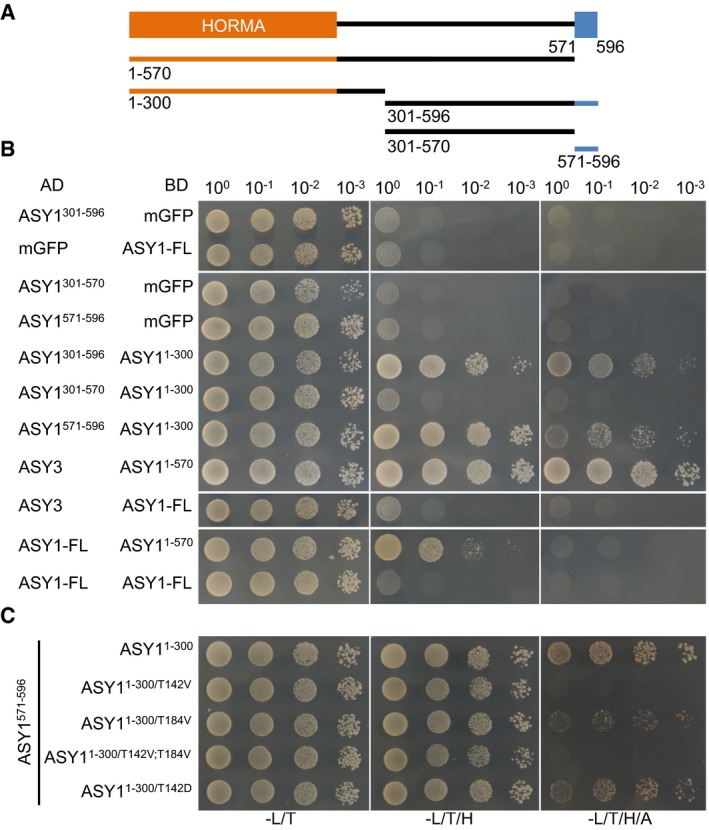
Figure 6. Phosphorylation of ASY1 affects its self‐assembly.

- Schematic graph of ASY1 full‐length protein (aa 1–596). The HORMA domain is depicted in orange, and the presumptive closure motif is highlighted in blue. The lines below indicate the constructs used for yeast two‐hybrid interaction assays.
- Interaction assays of different ASY1 fragments (with and without the closure motif).
- Interaction analysis of the ASY1 closure motif (ASY1571–596) with different ASY1 HORMA domain variants.
