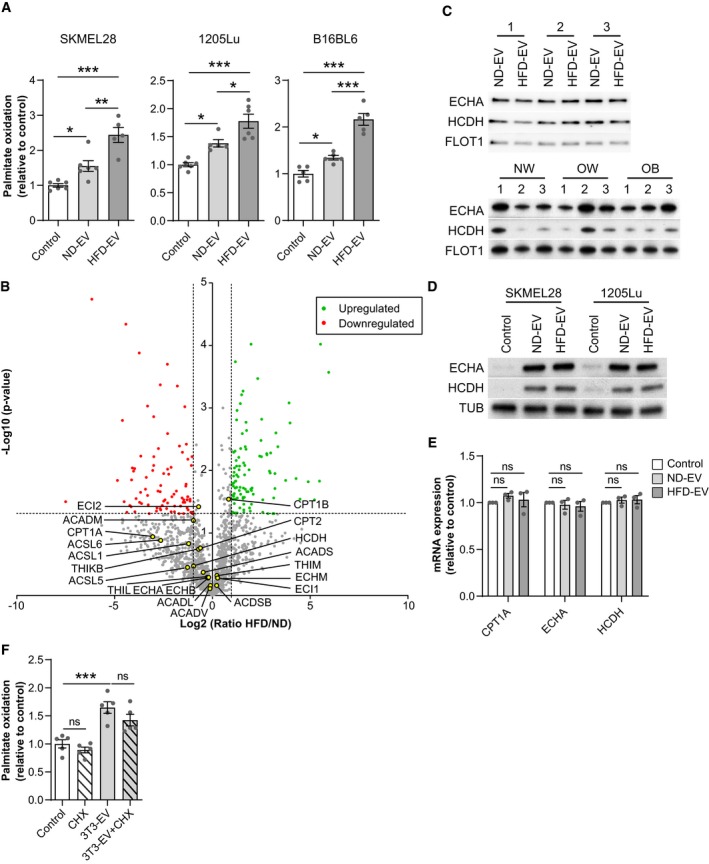
Two human (SKMEL28 and 1205Lu) and a murine (B16BL6) melanoma cell lines were exposed, or not, to the indicated EV from primary murine adipocytes obtained from lean mice fed a normal diet (ND) or obese mice fed a high fat diet (HFD), and then, FAO was measured (n = 5 for B16BL6, SKMEL28 HFD‐EV and 1205Lu ND‐EV and n = 6 for other conditions).
Volcano plot of mass spectrometry‐based quantitative proteomics results showing relative abundance of proteins in primary murine adipocyte EV from obese mice (HFD), as compared to those from lean mice (ND). The dashed lines indicate cutoff values and points colored in gray indicate proteins that display non‐significant fold‐change by Welch t‐test between both conditions (n = 3 for ND, 4 for HFD). Proteins involved in FAO are indicated by yellow dots.
Western blot analysis of the indicated FAO enzymes in the EV secreted by primary adipocytes from lean (ND) and obese (HFD) mice (top panel) and from human individuals with varying BMI (normal weight, NW; overweight, OW; and obese, OB) (bottom panel). For each blot, extracts from three independent batches of murine samples or three independent individuals for human samples (1–3) are shown. Flotillin 1 (FLOT1) is used as a loading control.
Western blot analysis of the indicated FAO enzymes in melanoma cells treated, or not, with EV from lean (ND) and obese (HFD) mice. Tubulin (TUB) is used as a loading control.
RT–qPCR analysis of mRNAs for the indicated genes in 1205Lu cells treated or not with EV secreted by primary adipocytes from lean (ND) and obese (HFD) mice for 48 h. Results are expressed relative to the corresponding value for control cells (n = 3).
Analysis of FAO levels in 1205Lu cells exposed to 3T3‐F442A EV and treated, or not, with cycloheximide (CHX) (n = 5).
Data information: Bars and error bars represent means ± SEM; statistically significant by one‐way ANOVA with
< 0.001, ns: non‐significant.

