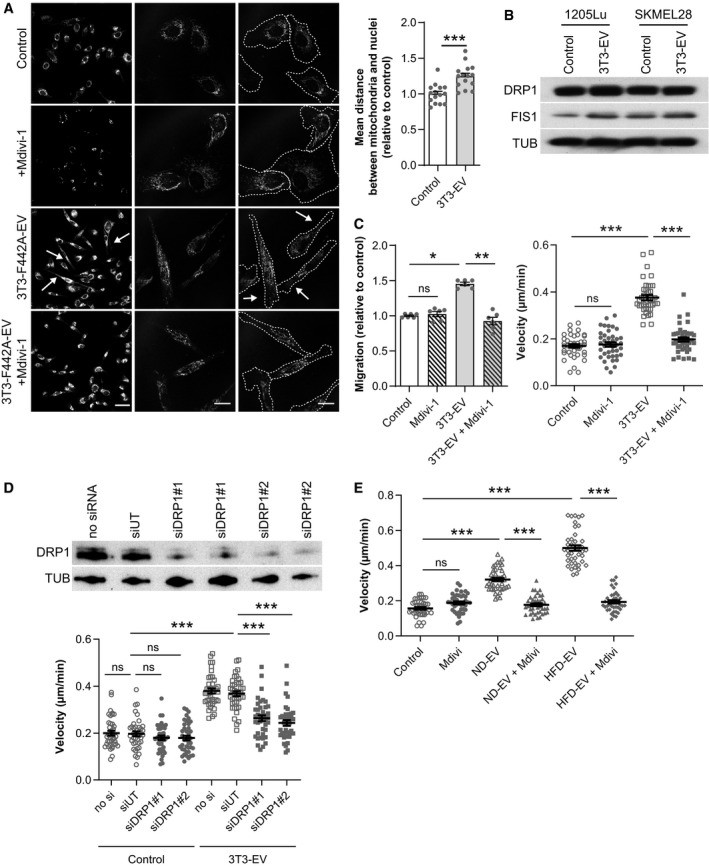
1205Lu cells exposed to 3T3‐F442A EV (3T3‐EV) and treated, or not, with Mdivi‐1, were stained with a MitoTracker probe, fixed, and observed by confocal microscopy. Arrows indicate the presence of mitochondria in membrane protrusions. On the images to the right, the outline of cells is shown in dotted lines. Scale bars: 20 μm. Right panel, quantification of the distance between mitochondria and nuclei (n = 15).
Western blot analysis of the indicated mitochondrial fission proteins in melanoma cells treated, or not, with EV from 3T3‐F442A adipocytes (3T3‐EV). Tubulin (TUB) is used as a loading control.
1205Lu cells were exposed to 3T3‐F442A EV (3T3‐EV) and treated, or not, with Mdivi‐1. Cell migration was then evaluated in Boyden chamber assays (left panel; n = 6). Right panel, 3T3‐F442A EV were added to 1205Lu cells, which were immediately treated, or not, with Mdivi‐1. Cell motility was then tracked by video microscopy (n = 40 cells per group) (right panel).
1205Lu cells were transfected, or not, with two different siRNA targeted against DRP1 (siDRP1#1 or 2) or an untargeted siRNA (siUT). Top, 48 h after transfection, protein extracts were prepared and DRP1 expression was evaluated by Western blot. Bottom, 36 h post‐transfection, cells were exposed to 3T3‐F442A EV (3T3‐EV), and cell motility was tracked by video microscopy (n = 40 cells per group).
1205Lu cells were exposed to adipocyte EV from lean mice fed a normal diet (ND) or obese mice fed a high‐fat diet (HFD) and immediately treated, or not, with Mdivi‐1. Cell motility was then tracked by video microscopy (n = 40 cells per group).
Data information: Bars and error bars represent means ± SEM; statistically significant by Student's
Dunn's test. *
< 0.01. ***
< 0.001, ns: non‐significant.