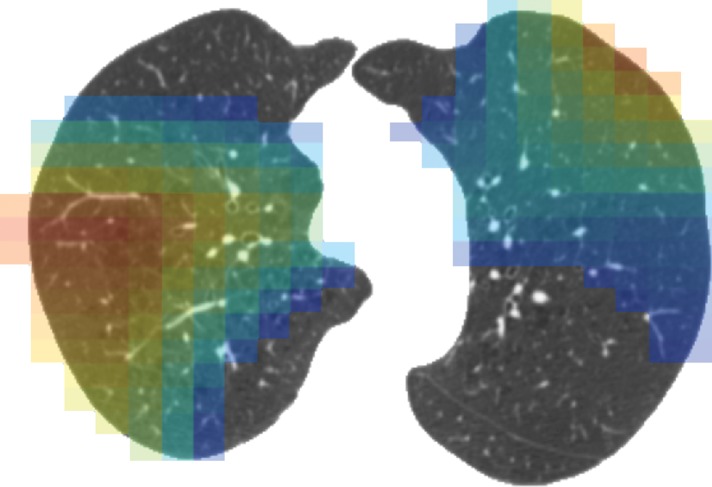
Figure 3e:
Representative CT scans from Genetic Epidemiology of COPD (COPDGene) testing cohort. Top row: Axial noncontrast CT sections classified as (a) trace, (b) moderate, or (c) advanced destructive emphysema by using both visual scoring and deep learning algorithm. Bottom row: (d–f) Heat maps show gradient-weighted class activation maps corresponding to input images a–c. Red shows image regions that result in largest network activations for each input image. Color maps are scaled to show regions with at least 50% of maximum activation for each input image. Source.—Reference 32.

