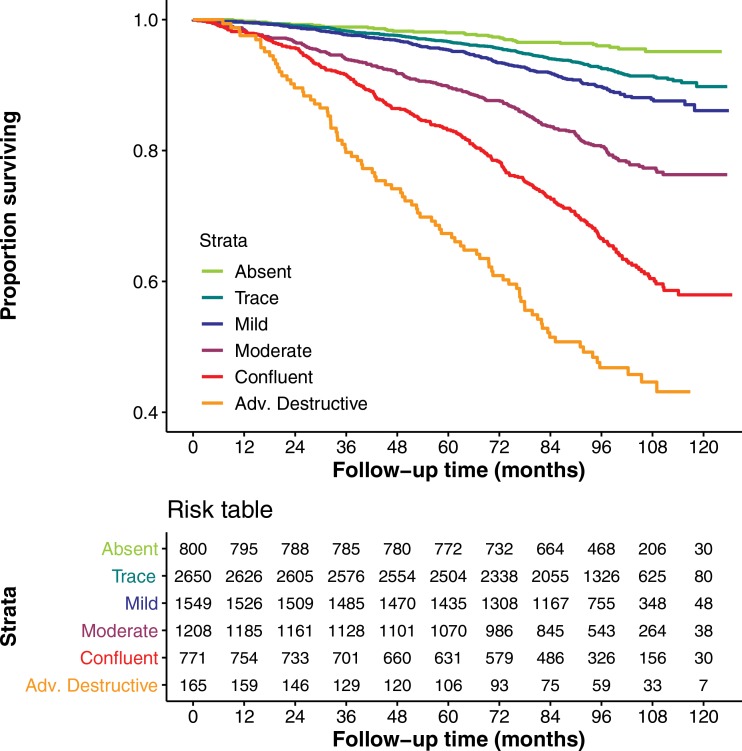
Figure 4b:
(a) Graph shows relationship between visual parenchymal emphysema pattern and survival in Genetic Epidemiology of COPD (COPDGene) test cohort. Kaplan-Meier curves show lower survival associated with higher grade of emphysema severity in 7143 participants included in mortality analysis. (b) Graph shows relationship between deep learning parenchymal emphysema pattern and survival in COPDGene test cohort. Kaplan-Meier curves show lower survival associated with higher grade of emphysema severity in 7143 participants included in mortality analysis. Deep learning separates confluent and advanced destructive emphysema better than does human scoring in terms of mortality discrimination.

