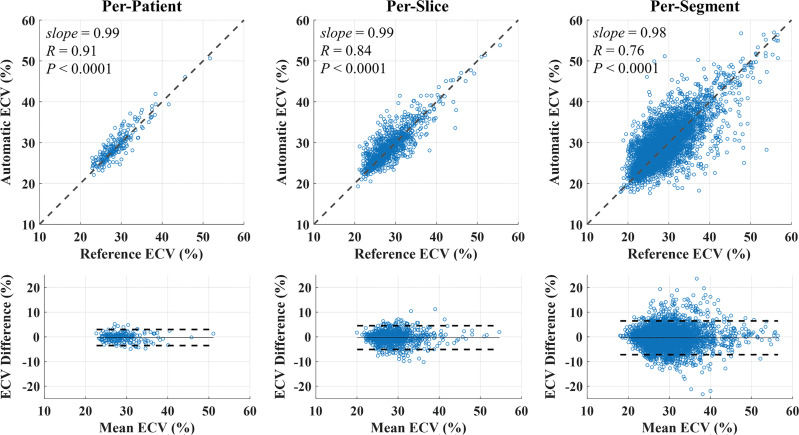
Figure 5:
Scatterplots and Bland-Altman plots of automated (using ) and reference extracellular volume (ECV) values in per-patient, per-slice, and per-segment analyses. Automated ECV measurement showed a strong correlation with reference ECV values in per-patient, per-slice, and per-segment analyses. Automated and reference ECV values were in good agreement in per-patient (−0.3% 61.7, 95% confidence interval [CI]: −3.5%, 3.0%), per-slice (−0.3% 6 2.5, 95% CI: −5.1%, 4.5%), and per-segment ECV (−0.4% 6 3.5, 95% CI: −7.2%, 6.5%) analyses. Solid and dashed lines in Bland-Altman plots represent the bias and 6 1.96 standard deviation limits, respectively. CNN = convolutional neural network.

