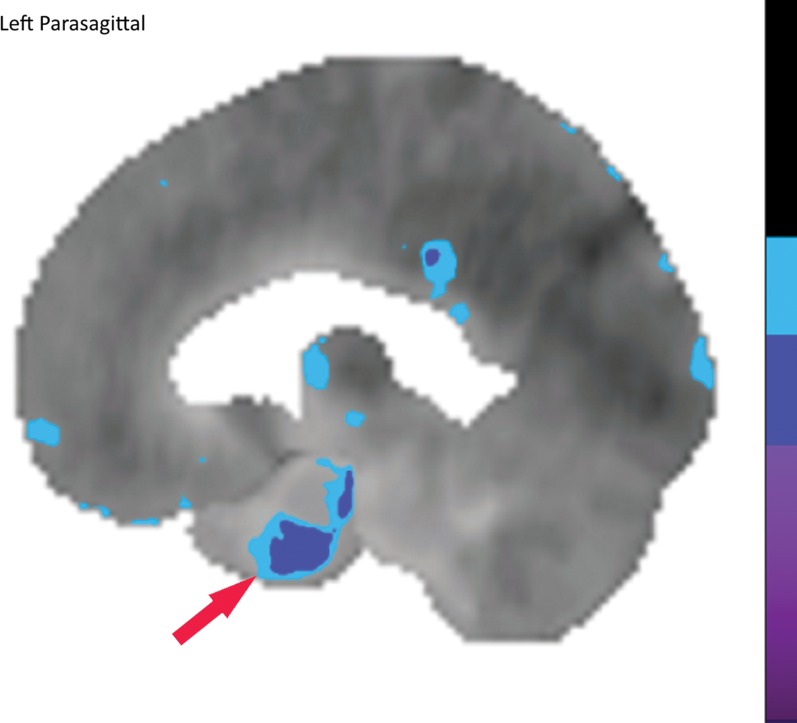
Figure 10a.
Computer-aided quantitation in FDG PET. (a) Sagittal color map of the z score of FDG uptake in a normal subject shows only minimal decreased uptake at the left mesial temporal lobe (arrow). (b) Sagittal color map in a patient with Alzheimer disease shows characteristic markedly decreased uptake along the cingulate gyrus (red arrow) and left precuneus region (green arrow). In these examples, light blue areas represent a z score between 1.6 and 2.3 (95–99th percentile), dark blue areas are between 2.3 and 3.1 (99–99.9th percentile), and purple areas are below 3.1 (99.9th percentile) standard deviations from those of normal examinations.

