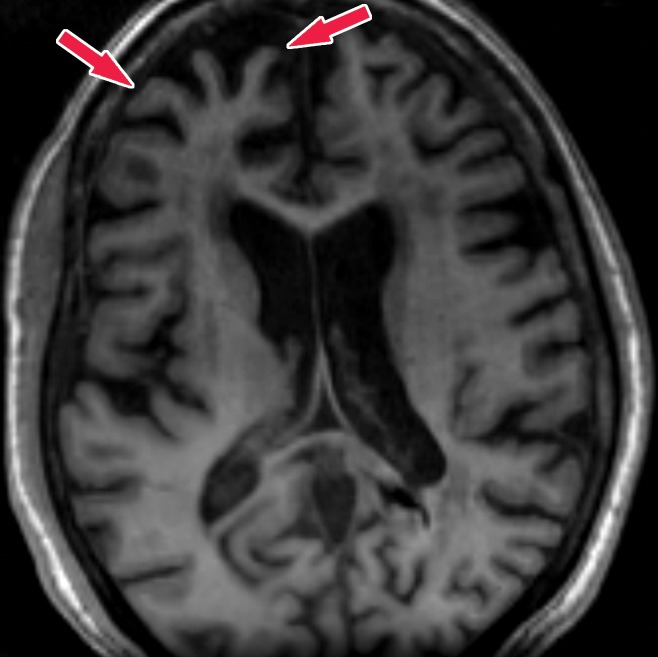
Figure 20a.
Frontotemporal lobar degeneration. (a, b) Axial T1-weighted MR images at the convexities (a) and temporal lobes (b) show moderate frontotemporal atrophy. Note the atrophy at the right frontal lobe (arrows in a). (c) Follow-up axial CT image at the lateral ventricles obtained 5 years later shows asymmetric worsening atrophy (arrows) on the right. (d) Axial CT image shows similar asymmetric worsening at the temporal lobes. (e, f) Coronal (e) and sagittal (f) 18F-FDG PET images obtained on the same day as the CT images show corresponding decreased activity in the frontal and temporal regions, findings compatible with FTLD. Image insets show a coronal section through the middle of the brain in this particular case to aid in lateralization.

