Figure 5.

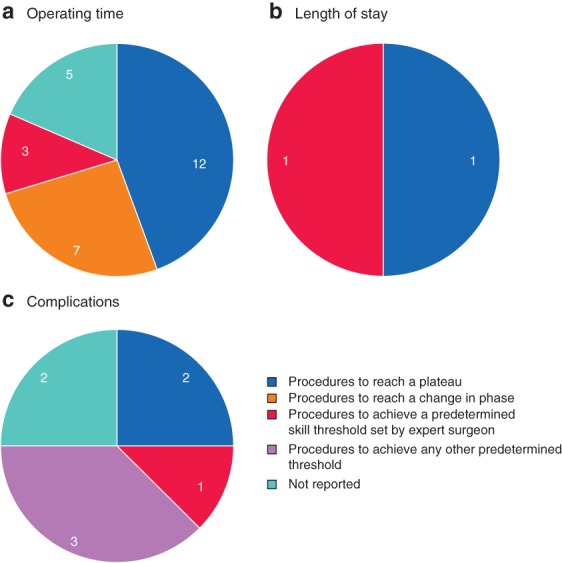
Pie chart of methods used to define the point at which learning curve was overcome a Operating time; b length of stay; c complications. Values indicate the number of studies using the method.

Pie chart of methods used to define the point at which learning curve was overcome a Operating time; b length of stay; c complications. Values indicate the number of studies using the method.