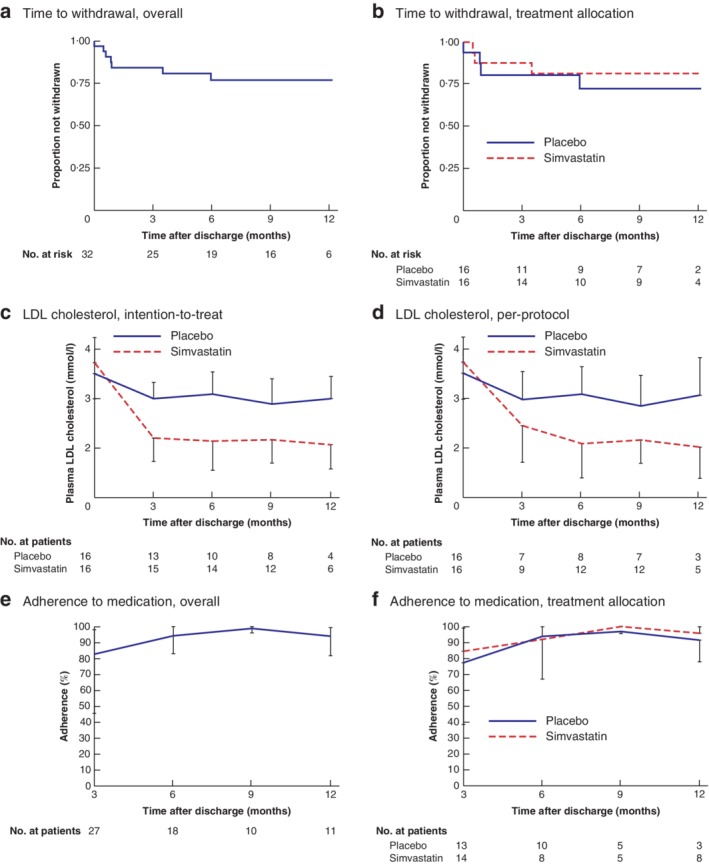
Figure 2.

Kaplan–Meier analysis of time to withdrawal, low‐density lipoprotein cholesterol during follow‐up, and adherence to trial medication
a,b Time to withdrawal overall (a) and according to treatment allocation (b). c,d Mean plasma low‐density lipoprotein (LDL) cholesterol levels during follow‐up according to treatment allocation for intention‐to‐treat (c) and per‐protocol (d) populations. Half error bars span from the mean to the upper or lower limit of the 95 per cent confidence interval. e,f Median percentage adherence to trial medication overall (e) and according to treatment allocation (f), calculated at each trial visit for the preceding 3 months. Half error bars span from the median to the upper or lower limit of the interquartile range.
