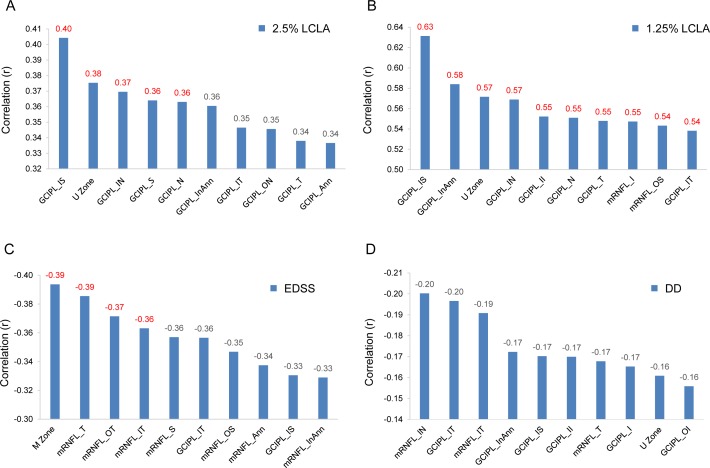
Figure 10.
Relationships between OCT thickness measurements and clinical manifestations. (A) The thickness of the U Zone was positively related to 2.5% LCLA (r = 0.38, P < 0.05), which was less than the GCIPL_IS. (B) The thickness of the U Zone was also positively related to the 1.25% LCLA (r = 0.57, P < 0.05), which was slightly weaker than some of the other partitions. (C) The thickness of the M Zone was negatively related to EDSS (r = −0.39, P < 0.05). (D) There were no significant relationships between DD and OCT thickness measurements. DD, disease duration.

