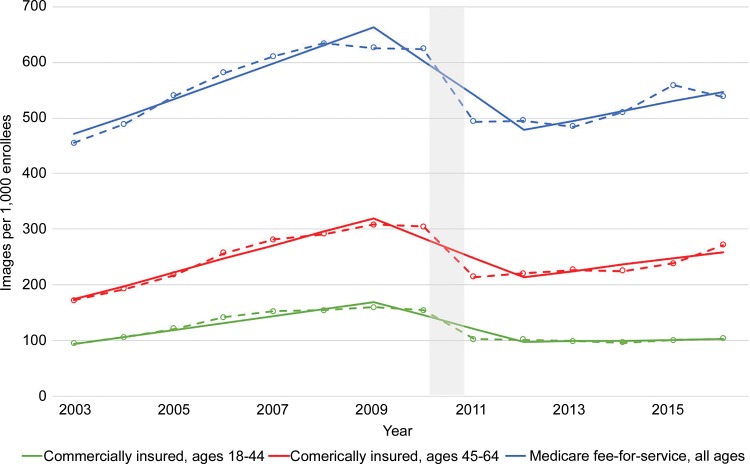
Figure 2:
Graph shows utilization rates of CT by insurance age group, based on analysis with Joinpoint Regression Program (version 4.5.0.1; Statistical Methodology and Applications Branch, Surveillance Research Program, National Cancer Institute, Bethesda, Md). Code bundling occurred in 2010–2011, denoted by gray bar. Solid lines are modeled trends; dotted lines are observed rates.

