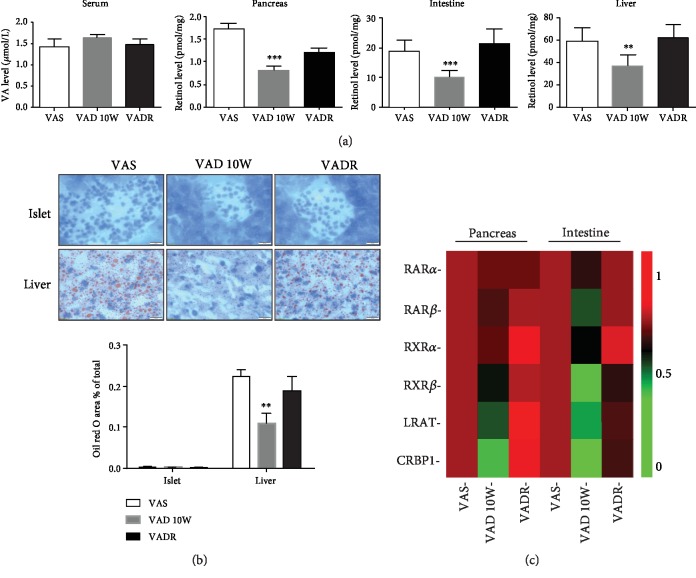
Figure 1.
VAD leads to reduction of tissue VA levels. (a) VA (retinol) levels in the serum, pancreas, intestines, and liver of mice from VAS, VAD, and VADR groups. (b) Representative photomicrographs of lipid droplets in the liver and islets using Oil red O staining from mice described for (a). (c) Heat map of PCR measurements of relative pancreatic/intestinal mRNA levels involved in VA metabolic signaling from mice described for (a). Magnification: 100x; scale bars, 20 μm. Error bars represent S.E. ∗p < 0.05, ∗∗p < 0.01, and ∗∗∗p < 0.001.

