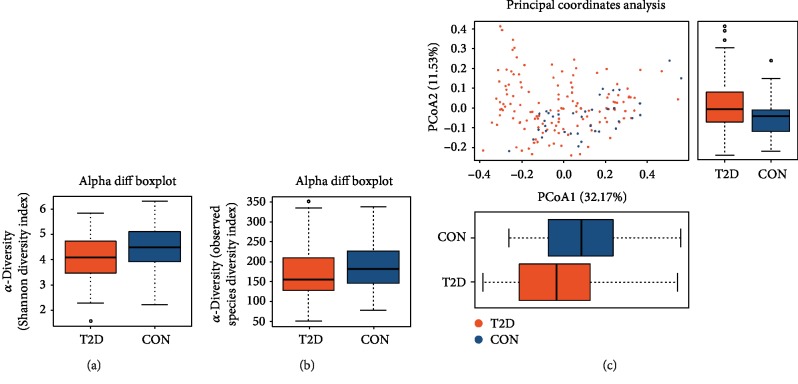
Figure 1.
The α-diversity and β-diversity analysis of the T2D and control groups. (a) The Shannon index difference between the T2D and control groups. P = 0.009. (b) The observed species index difference between the T2D and control groups. P = 0.040. The x-axes of both (a) and (b) show the two different groups. The y-axes show the α-diversity index value. Abnormal values are shown by “o.” (c) PCoA of the microbiota between the T2D and control groups. The x-axis represents the first principal coordinate, and the percentage represents the effect on the difference of the two groups. The y-axis represents the second principal coordinate, and the percentage represents the effect on the difference of the two groups. Px = 0.001, Py = 0.005. The bottom solid horizontal line represents the minimum value, the lower dotted vertical line represents the first quartile, the center solid horizontal line represents the median, the upper dotted vertical line represents the third quartile, and the top solid horizontal line represents the maximum value. The orange color represents the T2D group. The blue color represents the control group. CON: control group; PCoA: principal coordinates analysis.

