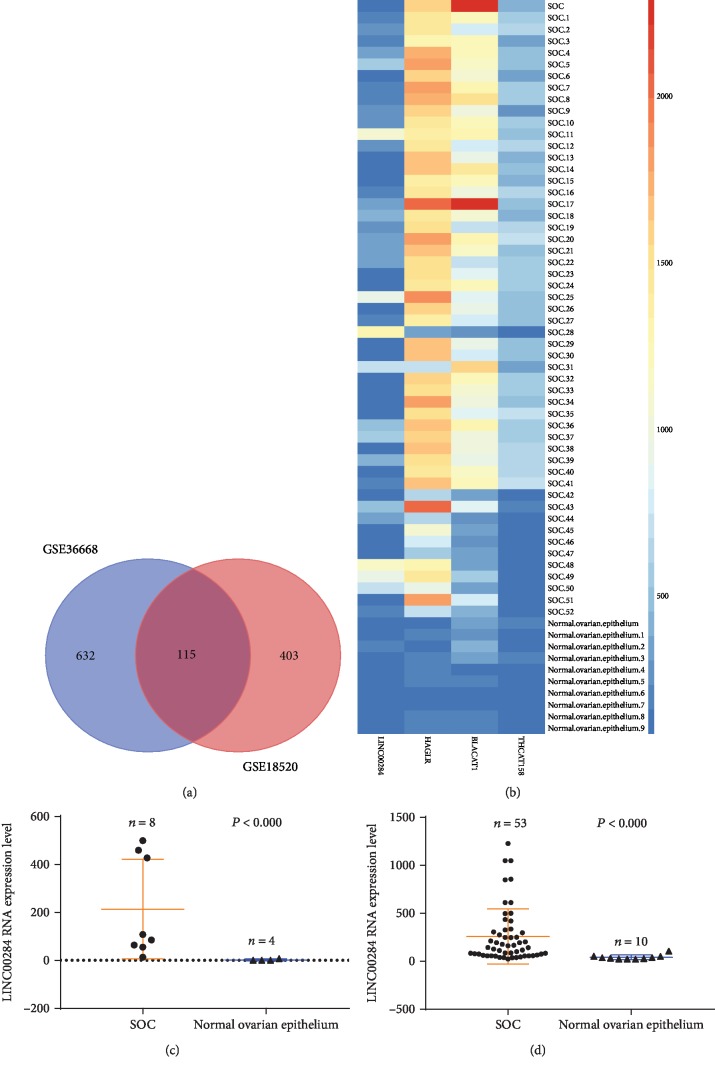
Figure 1.
Analysis of gene expression based on 2 GEO datasets (GSE36668 and GSE18520). (a) Venn analysis of lncRNAs and mRNAs upregulated in serous ovarian carcinoma compared to normal tissues from the 2 GEO datasets. (b) Heatmap of the 4 upregulated lncRNAs in 53 SOC tissues compared to 10 normal tissues. Each column represents one sample, and each row indicates one lncRNA. A color scale from blue (low) to red (high) indicates the level of normalized expression. (c, d) Functional plotting of the corresponding mRNA levels based on TCGA database: (c) GSE36668 dataset and (d) GSE18520 dataset. LINC00284 levels were higher in serous ovarian carcinoma samples than in normal samples.

