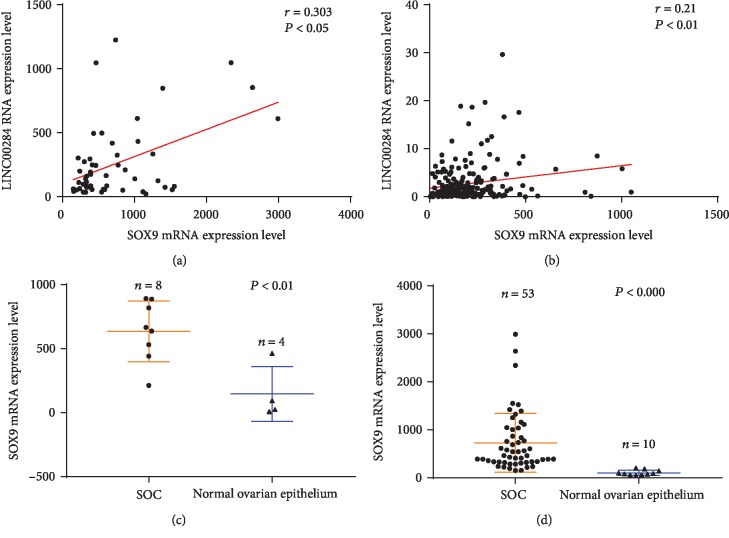
Figure 5.
Correlation analysis between SOX9 and LINC00284 expression based on the GEO (a) and TCGA (b) datasets. The expressions of SOX9 and LINC00284 were significantly and positively correlated. Functional plotting of the corresponding mRNA levels based on TCGA database. ((c) GSE36668; (d) GSE18520) SOX9 levels were higher in serous ovarian carcinoma samples than in normal samples.

