Figure 3.

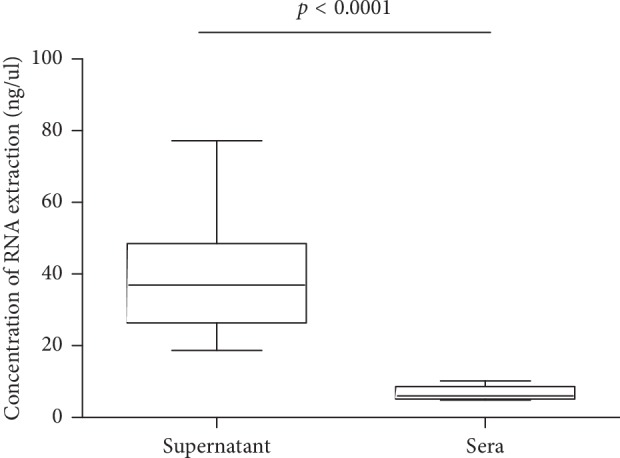
Concentration of cf-RNA extraction (ng/ul) in the MPE supernatant and matched sera as determined by using a spectrometer is plotted on the y-axis. Statistically significant differences were determined by using paired Student's t-test.

Concentration of cf-RNA extraction (ng/ul) in the MPE supernatant and matched sera as determined by using a spectrometer is plotted on the y-axis. Statistically significant differences were determined by using paired Student's t-test.