
Figure 2b:
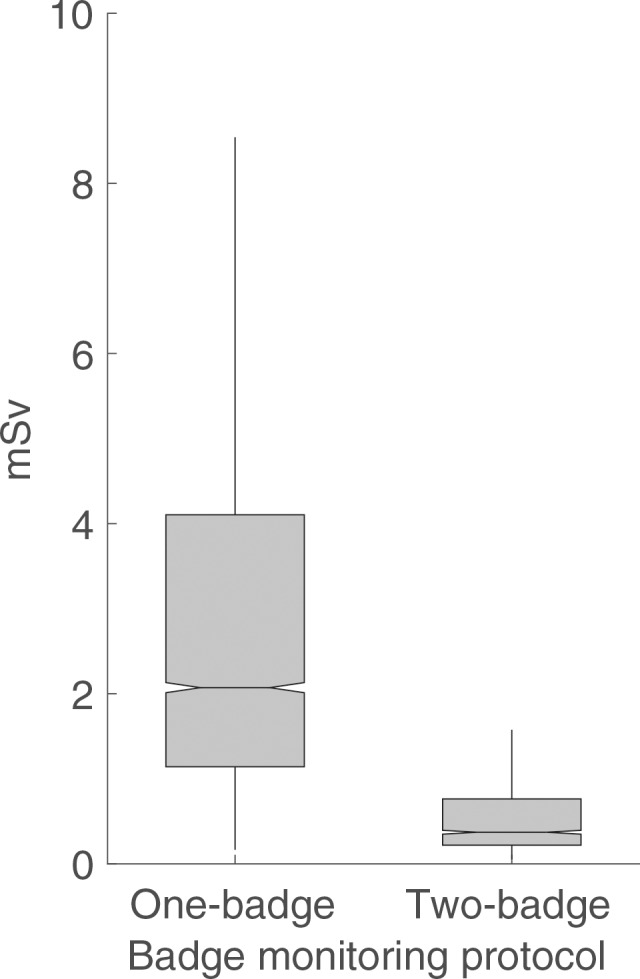
Box-and-whisker plots show (a) annual lens dose equivalent and (b) effective dose equivalent among workers monitored with a one-badge (n = 6218) and two-badge (n = 1449) protocol. The ends of the box are the upper and lower quartiles.
Official websites use .gov
A
.gov website belongs to an official
government organization in the United States.
Secure .gov websites use HTTPS
A lock (
) or https:// means you've safely
connected to the .gov website. Share sensitive
information only on official, secure websites.
Box-and-whisker plots show (a) annual lens dose equivalent and (b) effective dose equivalent among workers monitored with a one-badge (n = 6218) and two-badge (n = 1449) protocol. The ends of the box are the upper and lower quartiles.