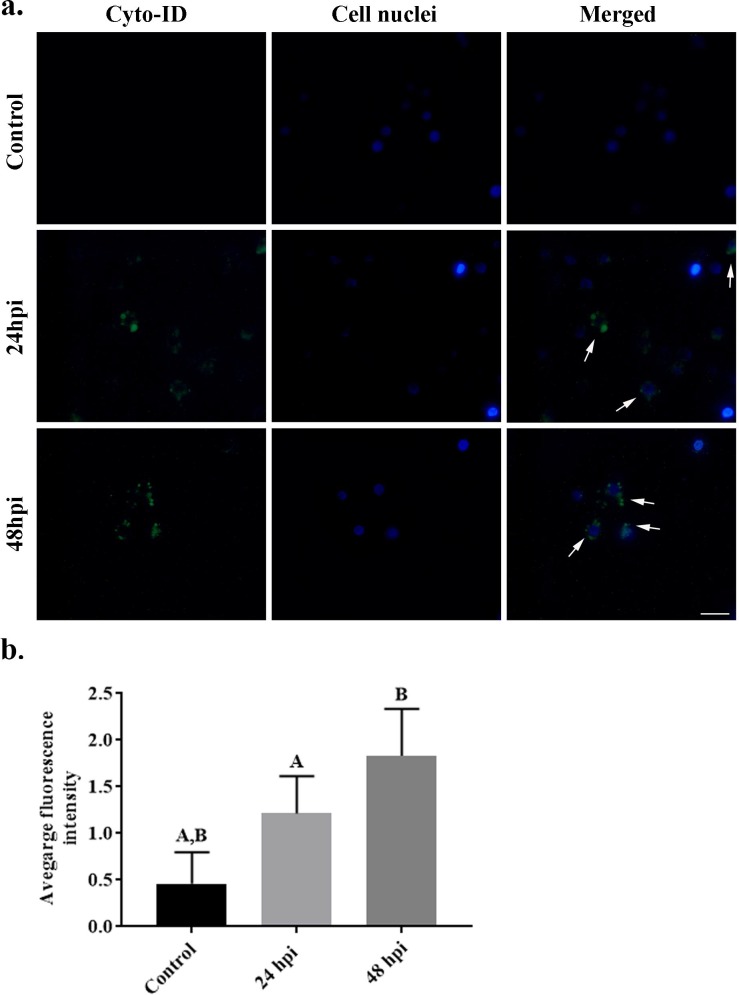
Fig 7. Hemocytes of Galleria mellonella control larvae, 24 hours post infection and 48 hours post infection with the entomopathogenic fungus Conidiobolus coronatus.
(a) The intensity of LC3 protein was evaluated by LC3 antibody staining and (b) their average fluorescence intensity was quantified. Blue color–nuclei labelled by DAPI (Ex/Em: 345/455 nm); Red/orange color–actin fibers labelled with ActinRed 555 kit reagent (Ex/Em: 540/565 nm); Green color–LC3 protein. Scale bar 10 μm.

