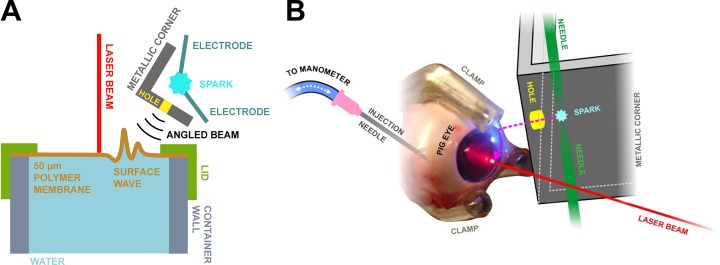
Fig 1. Schematic diagram of the measurement setup.
A) Setup used in the phantom experiments and B) Schematic diagram of the porcine eye measurement setup. An aluminum plate featuring a 2 mm size hole confined the shock wave excitation to a small area on the phantom/eye surface. The shock wave excitation generated a surface wave (here greatly exaggerated) on the polymer membrane/cornea and a laser Doppler vibrometer detected its passing.

