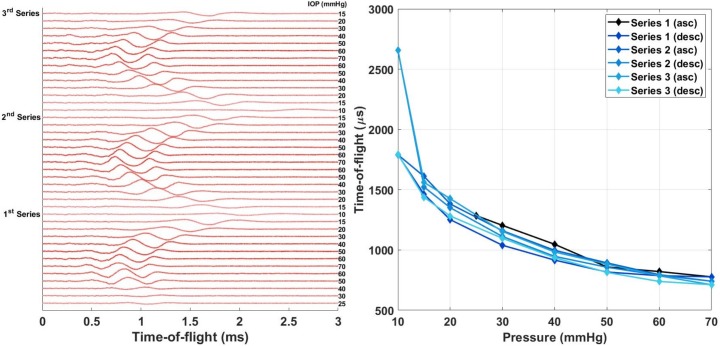
Fig 5. Repeatability of the method within one porcine eye.
(left) 2000-point Saviztky-Golay filtered raw signals measured at different IOPs in chronological order (top to bottom in the figure). IOP values, as determined by the manometer, in mmHg marked on the right next to the signals (darker color represents higher IOP). (right) Time of flight determined manually from the signals (highest peak) as a function of IOP.

