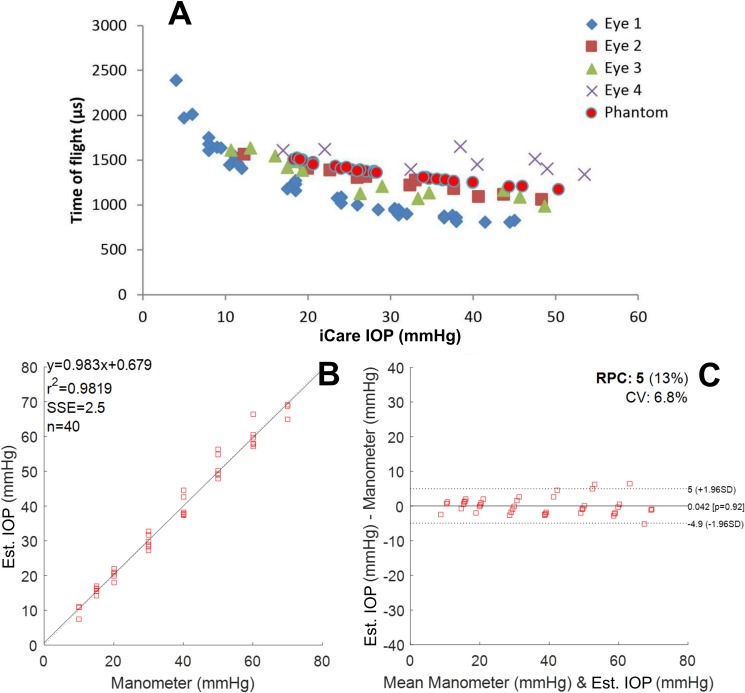
Fig 6.
A) Time of flight as a function of iCare IOP value, B) Estimated IOPs as a function of manometer (water column) values obtained with the method introduced in this study, C) Bland-Altman plot of our IOP estimate against manometer (water column) readings for the three pressure up-down repeats within one eye. Four different eyes are marked with different colors and shapes. The phantom measurements (Fig 4), analyzed with the same envelope function as the porcine eyes, are marked in the same figure with red circles (A). The fit (B) yields a reproducibility coefficient (RPC) of 5 mmHg and a summed squared of residuals (SSE) of 2.5 mmHg (C).

