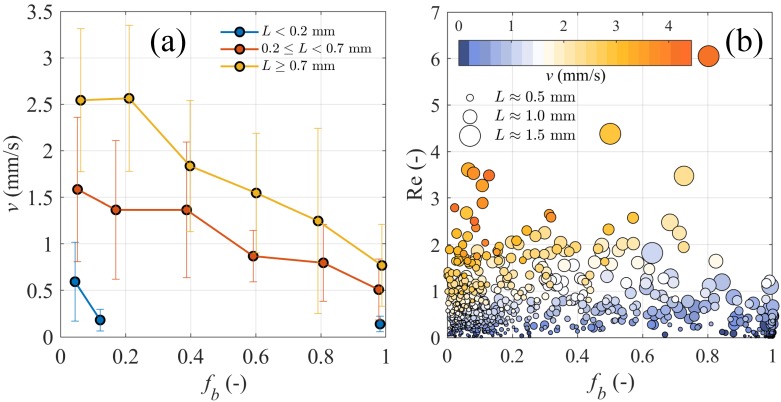
Fig 5. MP aggregate experimental settling velocity analyses.
(a) Bin-averaged experimental settling velocity v for aggregates at different size L as a function of biological fraction fb; error bars represent standard deviation in each bin. (b) Reynolds number Re over ranges of fb; colours of scattered points represent values of v and size of scattered points is linearly scaled with L ranging from 0 to 1.5 mm.

