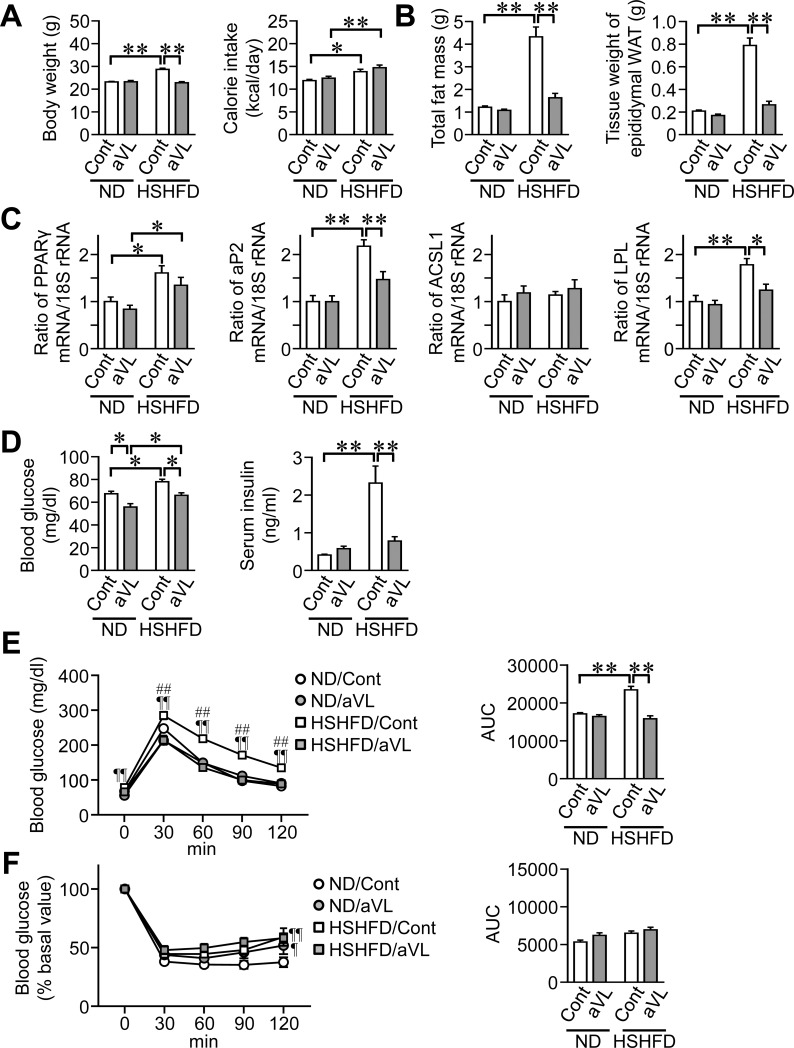
Fig 3. Effects of aVL on fat mass and glucose metabolism in mice fed HSHFD for 4 weeks.
(A) Data on body weight and calorie intake from control (Cont) and aVL mice fed ND or HSHFD. Body weight was measured 4 weeks after ND or HSHFD feeding. Food intake was collected for 3 days on days 26 to 28 after ND or HSHFD feeding was started and shown as a representative of the average daily calorie intake. (B) Fat mass in the whole body of control and aVL mice was assessed by QCT 4 weeks after ND or HSHFD feeding was started. The tissue weight of epididymal white adipose tissue (WAT) was measured 4 weeks after ND or HSHFD feeding. (C) Total RNA was extracted from the epididymal WAT of control and aVL mice 4 weeks after ND or HSHFD feeding was started. A real-time PCR analysis was then performed. Data are expressed relative to the levels of 18S rRNA. (D) Fasting blood glucose and insulin levels were measured 4 weeks after ND or HSHFD feeding was started. (E, F) Responses of blood glucose to a single intraperitoneal injection of glucose (E) and insulin (F) in control and aVL mice 4 weeks after ND or HSHFD feeding was started. The area under the curve (AUC) for 120 min was calculated. *P < 0.05 and **P < 0.01; ¶P < 0.05 and ¶¶P < 0.01, vs ND/Sham; ##P < 0.01, vs HSHFD/aVL (Tukey-Kramer test). Data represent the mean ± SEM of 8 mice in each group.

