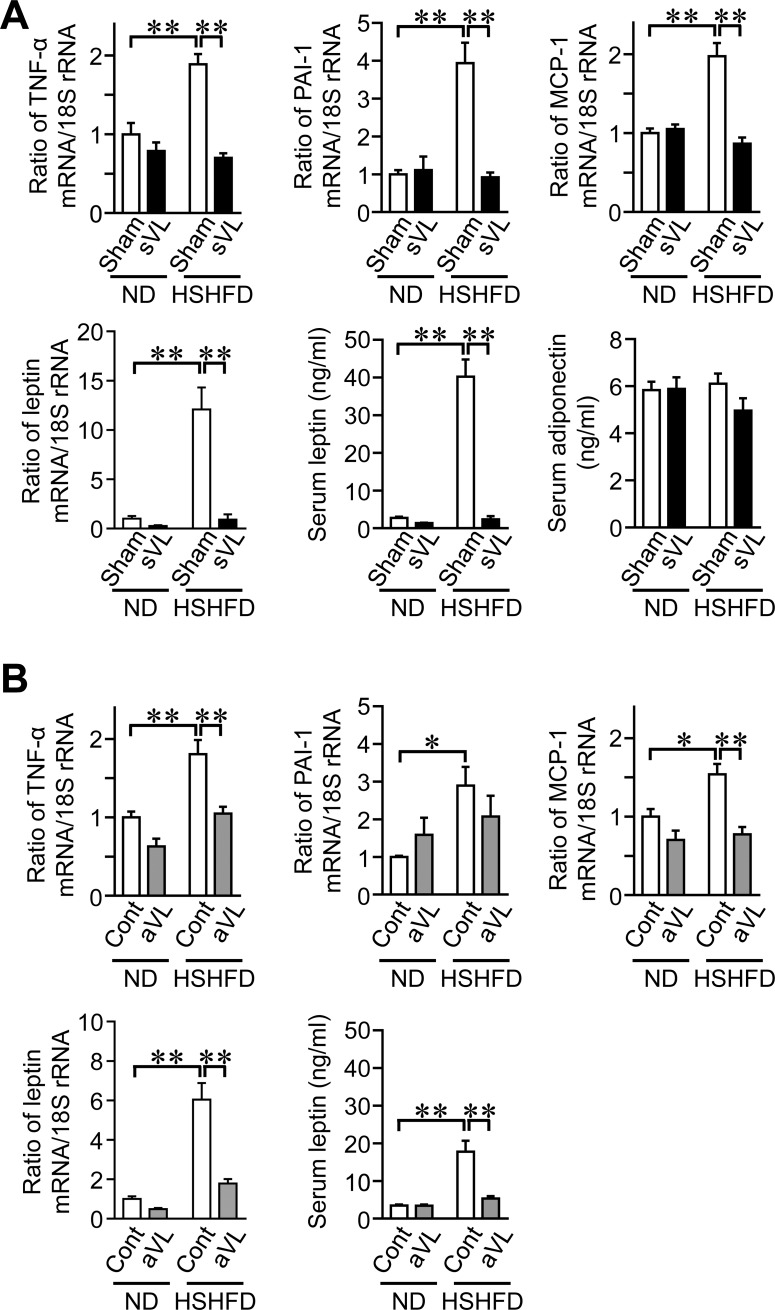
Fig 4. Effects of sVL and aVL on adipokine levels in mice fed HSHFD.
(A) Total RNA was extracted from the epididymal WAT of sham surgery and sVL mice 8 weeks after ND or HSHFD feeding was started. A real-time PCR analysis was then performed. Data are expressed relative to 18S rRNA levels. Serum samples were collected from sham surgery and sVL mice 8 weeks after ND and HSHFD feeding was started. The quantification of serum leptin and adiponectin levels was performed. (B) Total RNA was extracted from the epididymal WAT of control (Cont) and aVL mice 4 weeks after ND or HSHFD feeding was started. A real-time PCR analysis was then performed. Data are expressed relative to the levels of 18S rRNA. Serum samples were collected from control and aVL mice 8 weeks after ND and HSHFD feeding was started. The quantification of serum leptin levels was performed. *P < 0.05 and **P < 0.01 (Tukey-Kramer test). Data represent the mean ± SEM of 8 mice in each group.

