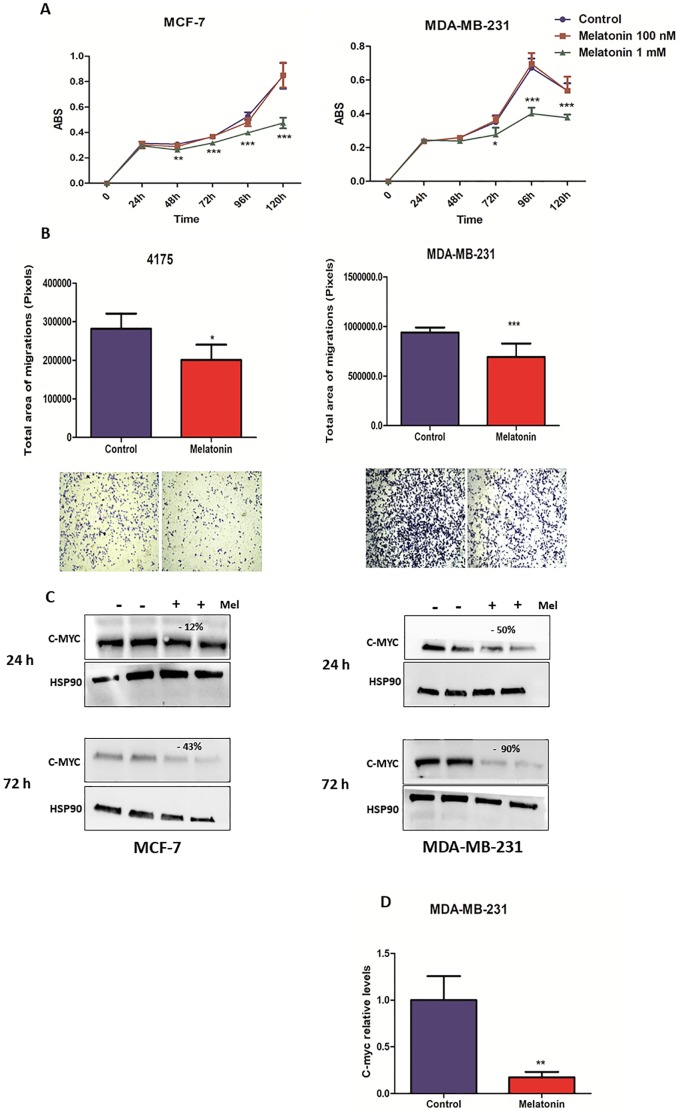
Fig 1. Melatonin inhibits cell proliferation, impairs migration and reduces c-Myc expression of breast cancer cells.
(A) MCF-7 and MDA-MB-231 cells have been treated with melatonin (1 mM) for 24, 48, 72, 96 and 120 h. Each point in the graph corresponds to the mean ± SEM of the triplicates plus or minus melatonin. The proliferation ratio was measured by optical density (* p <0.05, ***p < 0.0001 treatment versus control). (B) MDA-MB-231 and 4175-TGL cells have been treated with melatonin for 48 h and subjected to transwell migration assays. Histograms and photographs representing cell migration rate. Data represents the mean ± SEM of the transwell area covered by migrated cells, performed in triplicates plus or minus melatonin (* p <0.05, ***p < 0.0001 treatment versus control). (C) MCF-7 and MDA-MB-231 cells were treated with melatonin for 24 and 72 h and protein extracts were subjected to Western Blotting with the indicated antibodies. Protein expression was quantified by ImageJ program and calculated relative to controls, normalized with the endogenous HSP90 and expressed as percentages (%). (D) MDA-MB-231 cells were treated for 48 h, and mRNA levels measured by qRT–PCR analyses. Results are shown as fold changes (mean±s.e.m.) relative to control cells, normalized on B-actin level. (p** < 0.001 treatment versus control). SEM = Standard Error of Mean; ABS = Absorbance.

