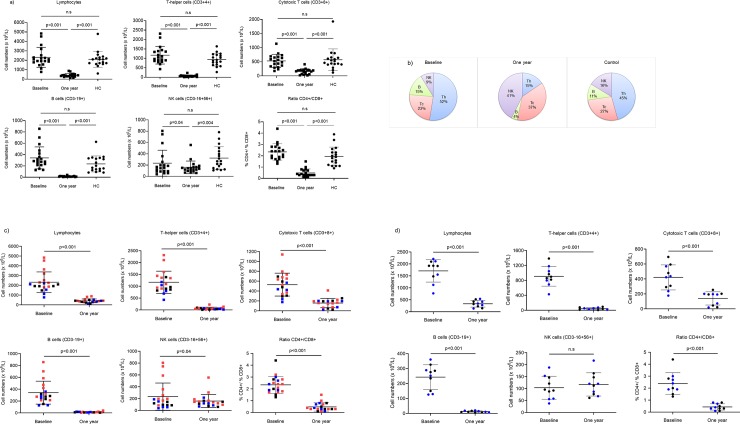
Fig 1. Distribution of lymphocytes in fingolimod treated patients and healthy controls.
(a) Scatter plots showing the number (x106/L) of lymphocytes, T helper (Th) cells, cytotoxic T (Tc) cells, B cells, NK cells and the ratio of CD4+/CD8+ (mean and SD) at baseline and after one year of fingolimod treatment in MS patients (n = 19) and in healthy controls (n = 18). (b) Pie charts illustrating the change in relative mean distribution of Th, Tc, B and NK cells at baseline, at the 1-year-follow up and in healthy controls. (c) Scatter plots highlighting the previous disease modifying treatment and the number of lymphocytes and subpopulations at baseline and after treatment. Red = natalizumab, blue = interferon-β, black = untreated. (d) Scatter plots excluding previously natalizumab-treated patients at baseline and after one year of fingolimod therapy.

