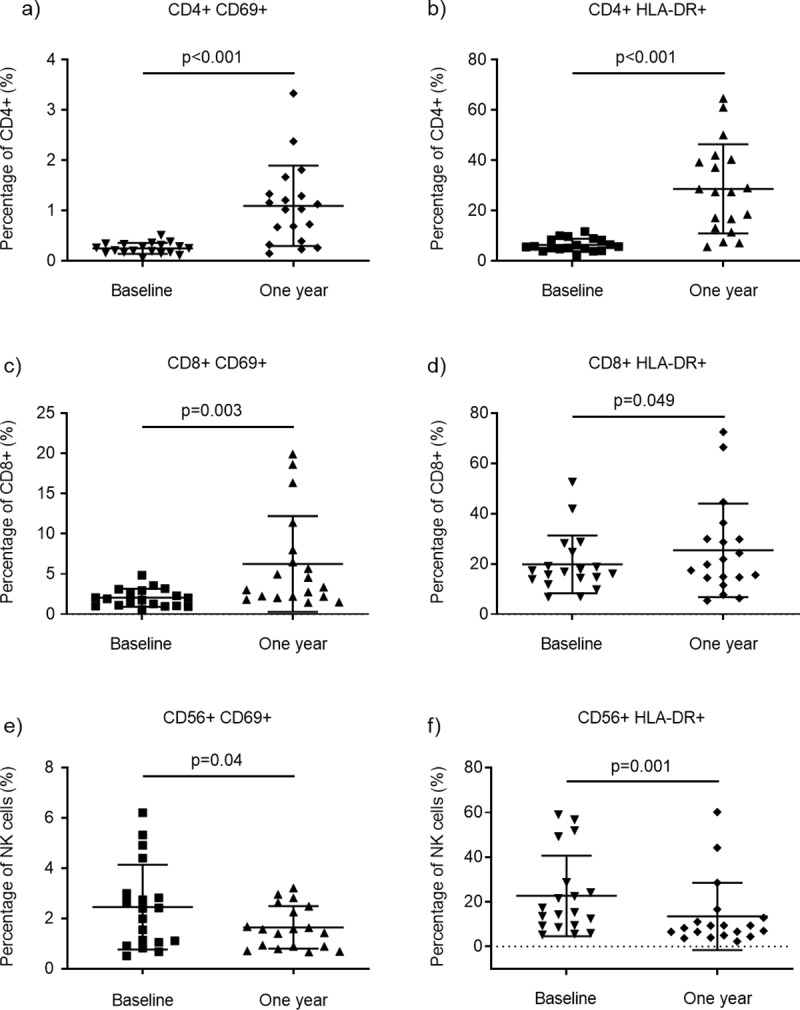
Fig 5. Effect of fingolimod on activation markers.

(a) Scatter plots showing the percentage (mean and SD) of CD4+ cells expressing the activation markers CD69 and (b) HLA-DR in patients at baseline and after 1-year fingolimod treatment (n = 19). (c) CD69 and (d) HLA-DR expression in CD8+ cells and in (e-f) NK cells.
