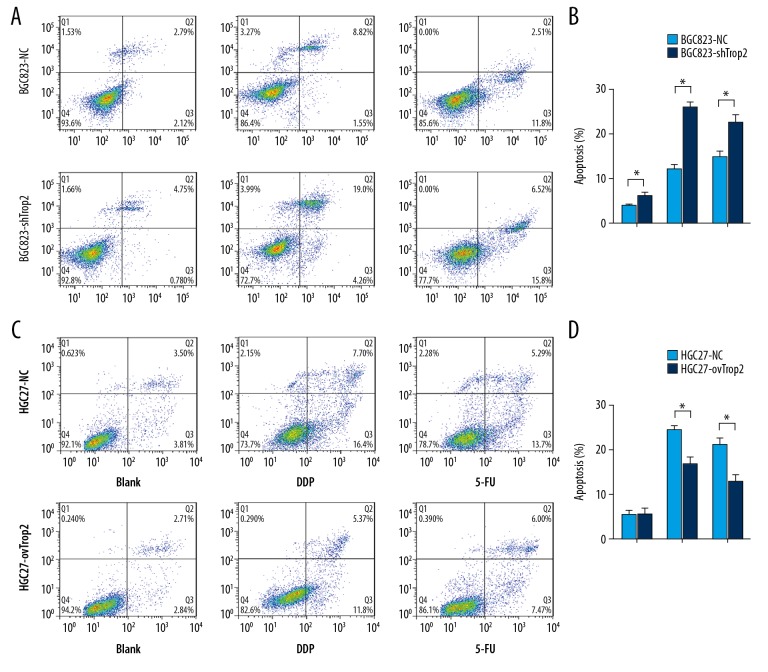
Figure 3.
Trop2 variation regulated GC cell apoptosis after chemotherapy. (A, B) The apoptosis rates of BGC823-NC and BGC823-shTrop2 cells were 3.84±0.635% and 6.31±2.13%, respectively. The apoptosis rates of BGC823-NC and BGC823-shTrop2 exposed to DDP were 11.907±1.571% and 26.407±2.784%, respectively. The apoptosis rates of BGC823-NC and BGC823-shTrop2 exposed to 5-FU were 17.707±2.479% and 22.227±3.822%, respectively. (C, D) The apoptosis rates of HGC27-NC and HGC27-ovTrop2 were 5.533±1.854% and 5.503±2.340%, respectively. The apoptosis rates of HGC27-NC and HGC27-ovTrop2 exposed to DDP were 24.533±1.512% and 16.687±3.222%, respectively. The apoptosis rates of HGC27-NC and HGC27-ovTrop2 exposed to 5-FU were 21.157±2.486% and 12.830±2.923%, respectively. * P<0.05

