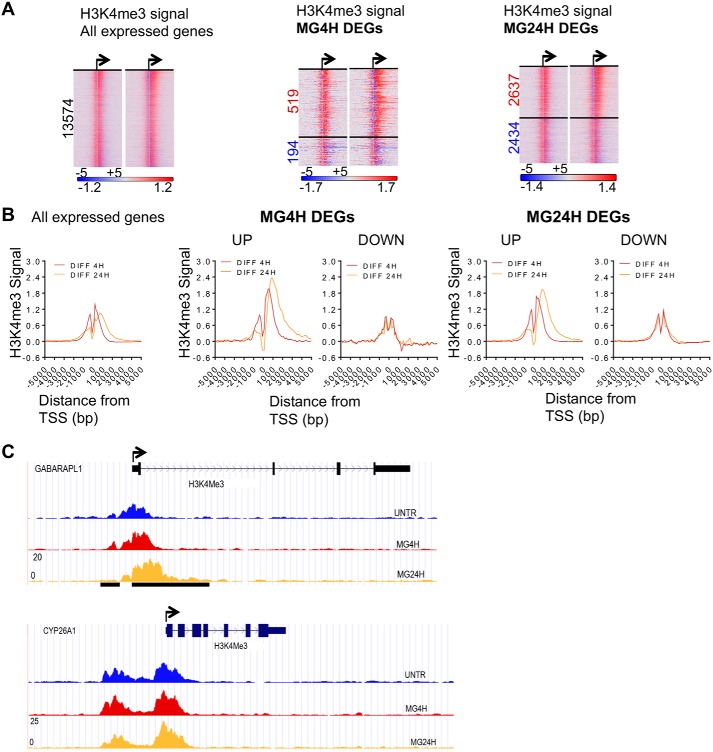
Figure 2.
Proteasome inhibition increases H3K4me3 spreading downstream of TSS into gene bodies. A, MG132 treatment causes an increase in H3K4me3 signal downstream of TSS of up-regulated genes. Heatmaps depicting differential normalized H3K4me3 ChIP-seq signal ranked by gene expression and centered around TSS ± 5 kb. All expressed genes are as follows: left panel: 13,574; MG4H DEGs, middle panel: UP, 519, and DOWN, 194; and MG24H DEGs: right panel: UP, 2637; DOWN, 2434. The two heatmaps for each expression group represent the difference in H3K4me3 signal at 4 and 24 h, respectively. Up-regulated genes are indicated in red, and down-regulated genes are indicated in blue. B, metagene plots of average H3K4me3 differential signal after 4 and 24 h of treatment. C, UCSC browser representation showing H3K4me3 spreading (black bar) at TSS of GABARAPL1 (shared up), but not at TSS of CYP26A1 (shared down). Black arrow represents putative TSS and direction of transcription.

