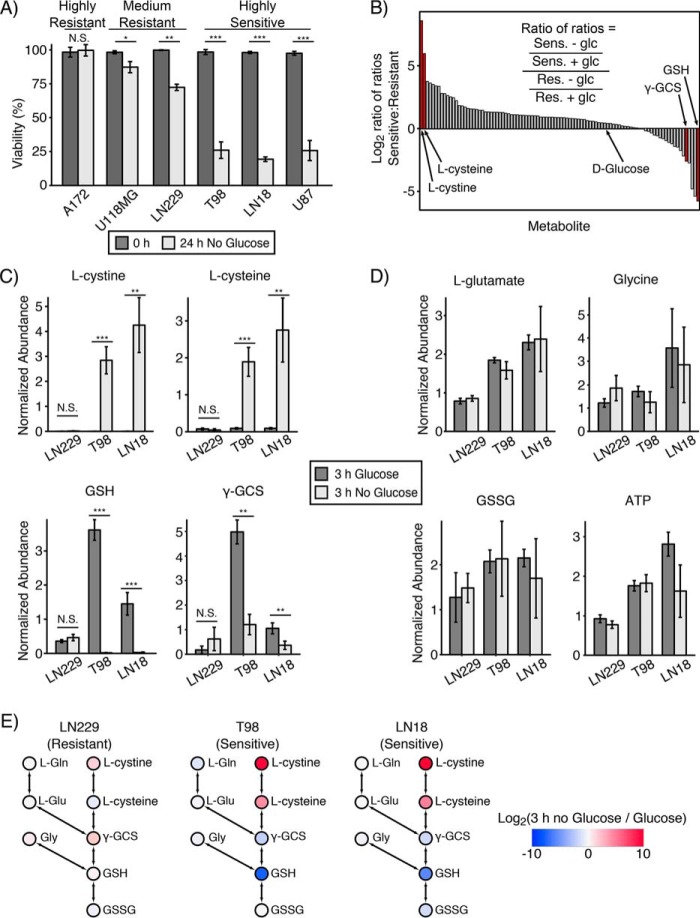
Figure 1.
Accumulation of l-cystine and l-cysteine and depletion of reduced GSH are metabolic markers of sensitivity to glucose deprivation. A, panel of GBM cell lines was subjected to glucose deprivation for 24 h, and viability was measured by trypan blue exclusion. A172 exhibited strong resistance; LN229 and U118MG cells exhibited medium resistance; and T98, LN18, and U87 cells exhibited high sensitivity to glucose deprivation. N.S. denotes p > 0.05; * denotes p < 0.05; ** denotes p < 0.01; *** denotes p < 0.001 by Student's t test (n = 3). B, two glucose deprivation–sensitive (Sens) cell lines (T98 and LN18) and one medium-resistant (Res) cell line (LN229) were deprived of glucose for 3 h in the presence of l-[U-13C]glutamine and then profiled by LC-MS metabolomics. A total of 97 metabolites were identified and quantified. Metabolite pool sizes were ranked using a log2 ratio–of–ratios metric ((average of T98 ± glucose and LN18 ± glucose)/(LN229 ± glucose)). l-Cystine and l-cysteine and reduced glutathione (GSH) were the most differentially regulated metabolites (red bars). γ-GCS was also differentially regulated in glucose deprivation–sensitive cells (rank 93 of 97). C, bar plots from LC-MS metabolomics in B, showing that l-cystine and l-cysteine were accumulated, and GSH and γ-GCS were depleted in glucose deprivation–sensitive GBM cells following 3 h of glucose deprivation. * denotes p < 0.05, ** denotes p < 0.01, and *** denotes p < 0.001 by Student's t test (n = 3). D, individual bar plots from LC-MS metabolomics showing that the GSH synthesis precursors glycine and l-glutamate, as well as oxidized GSH (GSSG) and ATP, were not significantly regulated by 3 h of glucose deprivation in either resistant (LN229) or sensitive cells (T98 and LN18). E, log2 fold change in metabolite pool sizes upon 3 h of glucose deprivation overlaid on the GSH synthesis pathway. Red and blue represent accumulation and depletion, respectively, as shown on the indicated color scale. l-Gln, l-glutamine; l-Glu, l-glutamate; Gly, glycine. Error bars are standard deviation of the mean.

