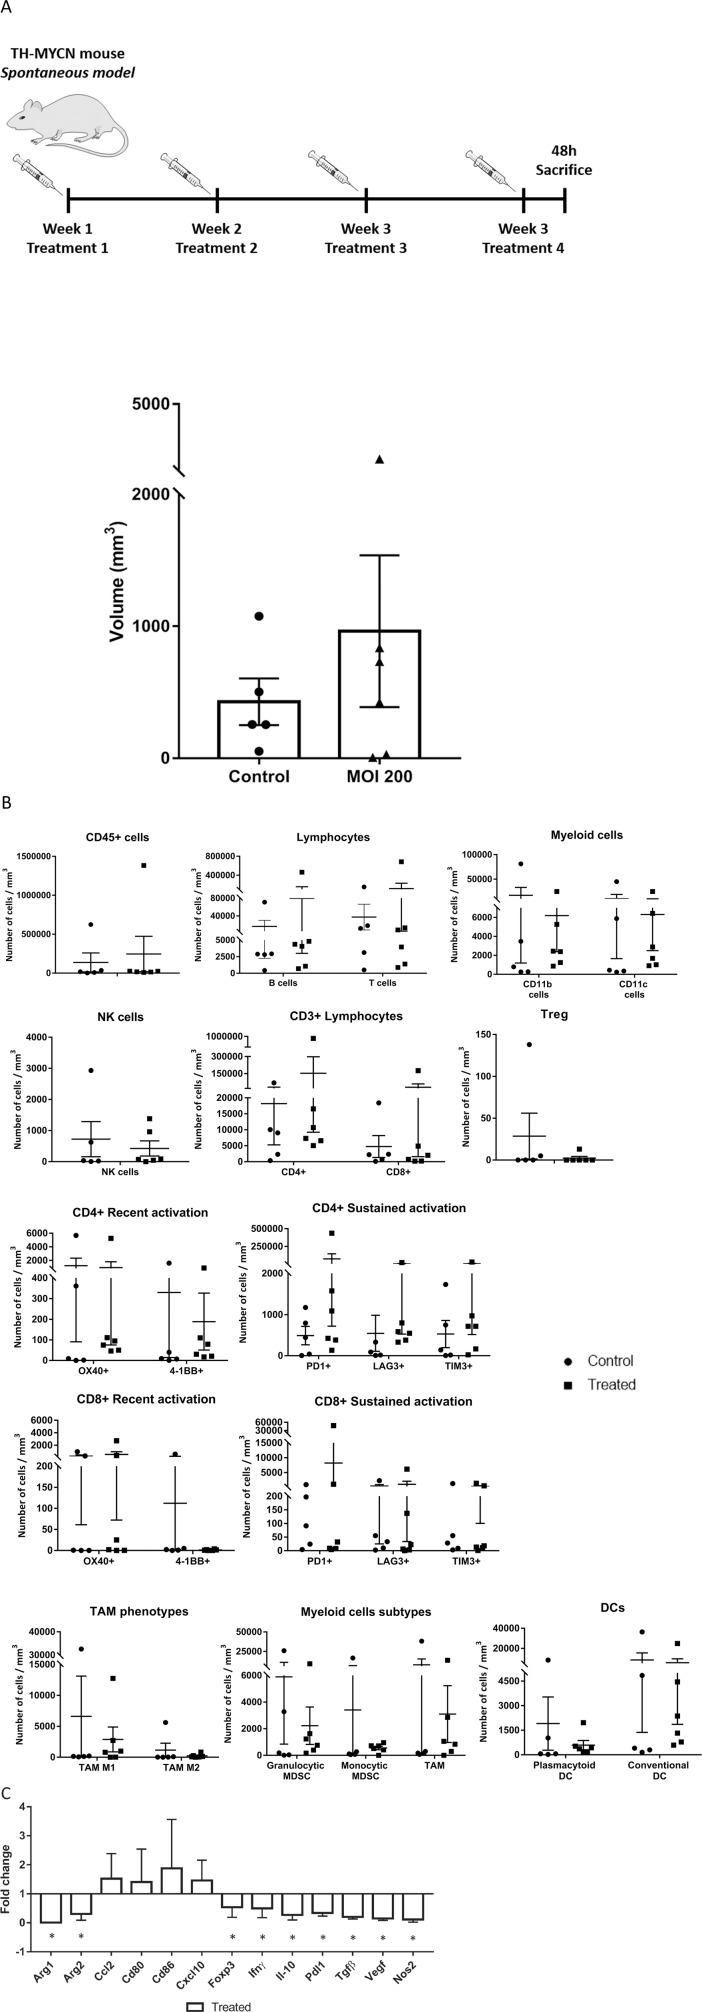
Figure 3. Effects of systemically administered mCelyvir in tumors in a spontaneous model of NB.
(A) Tumor volumes recovered after four weekly treatments of intravenous mCelyvir and untreated controls. (B) Infiltrating immune cells per milliliter of tumor in both groups of animals. (C) Expression levels of immune-related genes of tumor microenvironment analyzed by qRT-PCR. Results were normalized to untreated controls (normalized value = 1). Statistics differences are represented by * (p < 0.05) or ** (p < 0.01).

