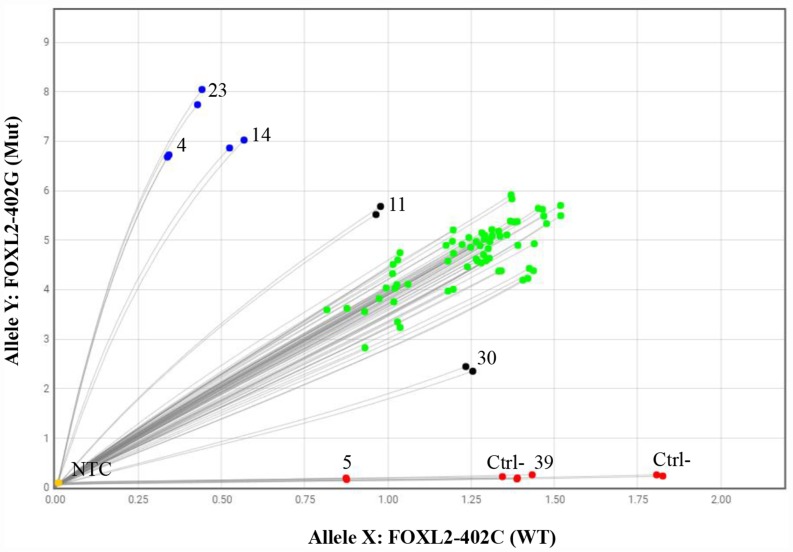
Figure 1. The qPCR allelic discrimination assay.
Green dots represent samples that were heterozygous for the FOXL2 c.402C>G mutation (with a fluorescent signal from both wild-type and mutant probes), blue dots represent samples that were homozygous for the FOXL2 c.402C>G mutation (with a fluorescent signal from the mutant probe only), red dots represent wild-type samples (with a fluorescent signal from the wild-type probe only), black dots represent samples for which the genotype could not be determined, and yellow dots are the no-template controls. Each sample was tested in duplicate. Ctrl-: negative control; NTCs: no-template controls.

