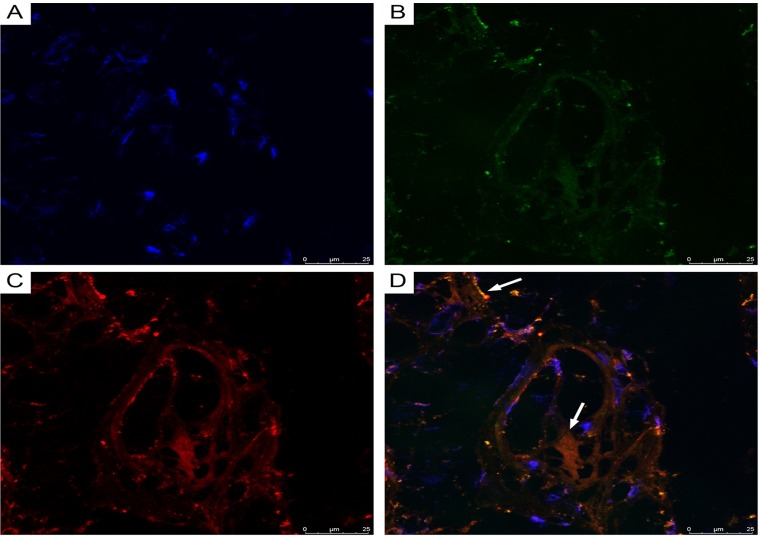
Figure 13. CLSM of glioblastoma.
(A) Blue fluorescence of cell nuclei (DAPI); (B) Green fluorescence of CD34/Alexa Fluor488; (C) Red fluorescence of NG2/Alexa Fluor568; (D) Overlay of images (A–C). Same-cell CD34/NG2 co-expression (orange fluorescence), indicated by arrows, is visible in glioblastoma vessels (frozen sections, 200×).

