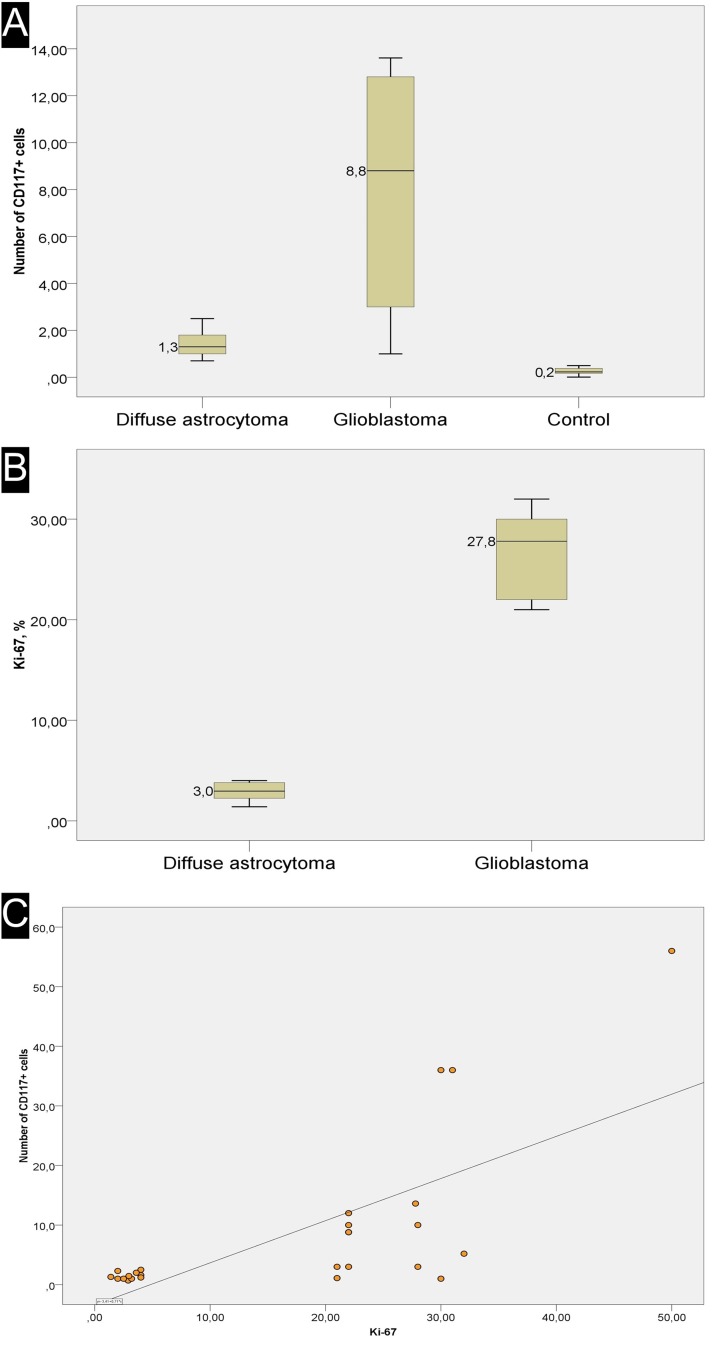
Figure 3. Overview of Ki-67 expression and correlation with number of CD117+ cells.
(A) the average number of CD117+ cells in one *field of view. (B) the average number of Ki-67+ cells in one *field of view. (C) scatter plot with a regression curve showing the linear relationship between Ki-67 index and the number of telocytes. *(400×)

