. 2019 Dec 24;8:e50793. doi: 10.7554/eLife.50793

Figure 6. BiP-mediated monomerisation of IRE1LD ∆∆ assessed by hydrogen exchange mass spectrometry (HX-MS).

(A) Difference plot of deuteron incorporation comparing wild-type (wt) IRE1LD with the monomeric mutants IRE1LD W125A (orange trace) or IRE1LD P108A (pink trace) after 30 s incubation in D2O [see Table 2 for the amino acid (aa) sequence of the individual segments]. Protein concentration was 5 µM. Shown are data from three independent experiments [mean ± standard deviation (SD)]. Boxes 1 and 2 highlight regions of greater hydrogen exchange (HX) in the monomeric mutants compared to wt IRE1LD that were analysed in presence of chaperones in ‘C’ (see Figure 6—source data 1). (B) Cartoon representation of the IRE1LD dimer (PDB: 2HZ6) coloured according to the difference of deuteron incorporation between wt and IRE1LD P108A after 30 s of incubation in D2O (from ‘A’). (C) Difference plot of the deuteron incorporation between the untreated sample and samples exposed to the indicated additives. The data for the same peptic peptides from wt IRE1LD and the IRE1LD ΔΔ mutant are displayed separately. Protein concentrations were 5 µM IRE1LD (wt or ∆∆ mutant), 30 µM BiP (wt or V461F mutant), 6 µM ERdj4 (wt or QPD mutant) and 2 mM ATP. Shown are the means ± SD of three data sets acquired after 30 s incubation in D2O (the corresponding 300 s data set is presented in Figure 6—figure supplement 1A and C) (see Figure 6—source data 2).

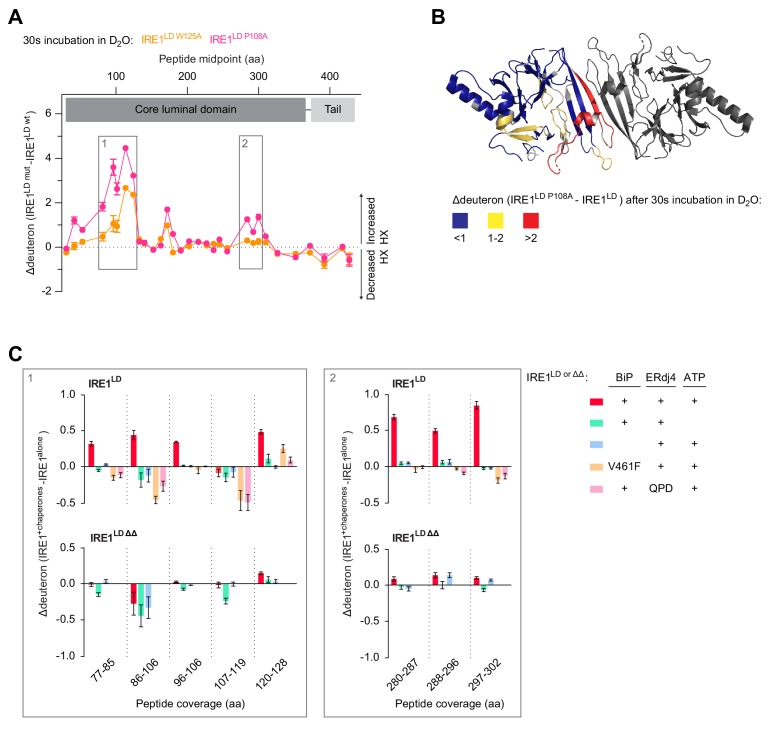
Figure 6—source data 1. Source data for Figure 6A and Figure 6—figure supplement 1A.
Figure 6—source data 2. Source data for Figure 6C and Figure 6—figure supplement 1C.

Figure 6.

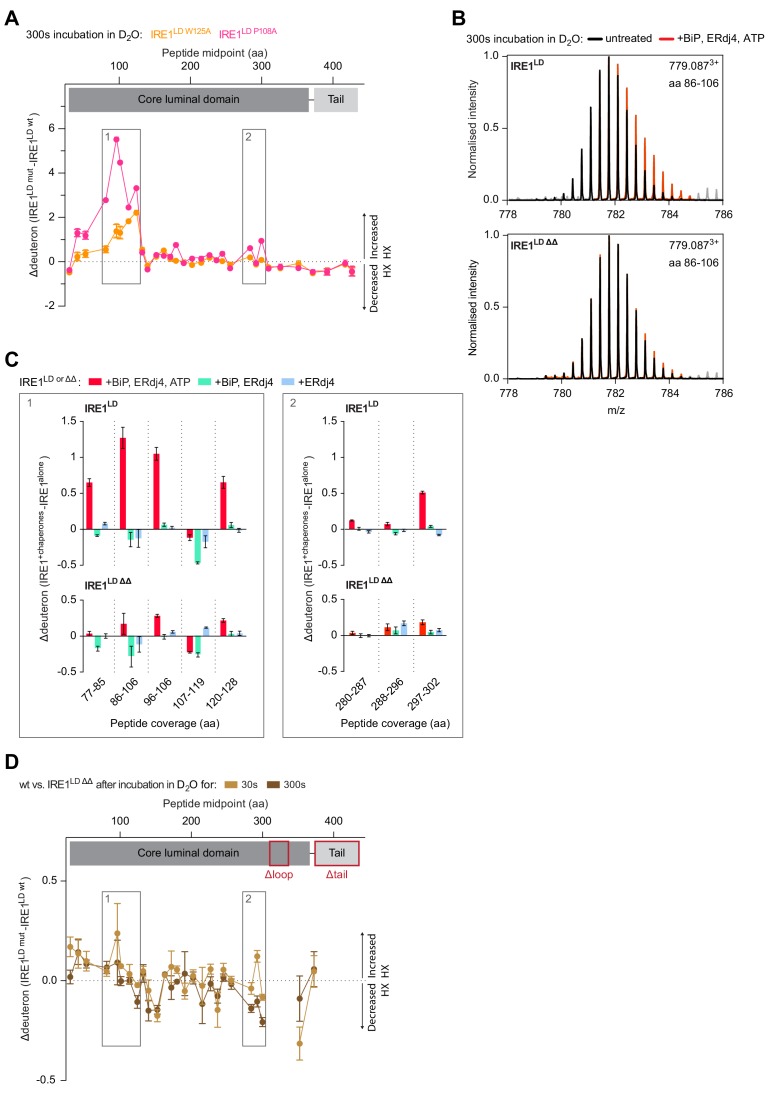
Figure 6—figure supplement 1. HX-MS evidence for impaired BiP- and ERdj4-driven monomerisation of IRE1LD ΔΔ.

Figure 6—figure supplement 1.

(A) Difference plot of deuteron incorporation into the indicated peptic peptides of wild-type (wt) versus IRE1LD W125A or wt versus IRE1LD P108A after 300 s incubation in D2O (as in Figure 6A) (see Figure 6—source data 1). (B) Overlay of representative spectra showing the isotope cluster of peptic fragment 779.0873+ (residues 86–106) from wt or IRE1LD ∆∆, untreated (black) or exposed to BiP, ERdj4 and ATP (red) after 300 s incubation in D2O. Peaks arising from overlapping BiP peptides are coloured in grey. Note the stronger shift of the peaks towards higher m/z values (indicating an increased deuteron incorporation) in case of wt IRE1LD in presence of BiP, ERdj4 and ATP. (C) Difference plot of the deuteron incorporation between the untreated sample and samples exposed to the indicated additives. The data for the same peptic peptides from wt and the IRE1LD ΔΔ mutant are displayed separately (as in Figure 6C, but after 300 s incubation in D2O) (see Figure 6—source data 2) (D) Difference plot of deuteron incorporation into the indicated peptic peptides of wt versus IRE1LD ∆∆ mutant after 30 or 300 s incubation in D2O as in Figure 6A (in absence of chaperones). Regions deleted in IRE1LD ΔΔ are excluded from the difference plot.
Figure 6—figure supplement 1—source data 1. Source data for Figure 6—figure supplement 1E.