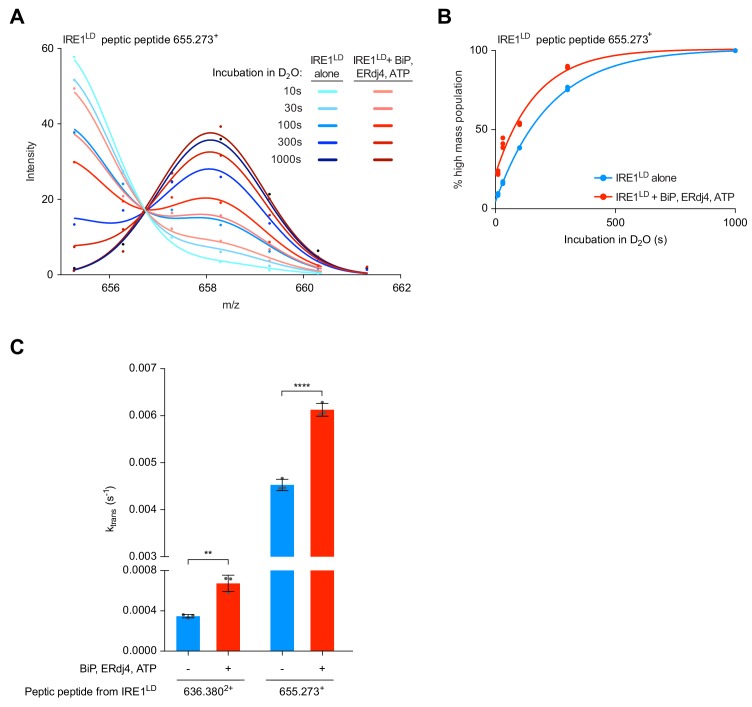
Figure 7. Analysis of bimodally-distributed isotope clusters of IRE1LD peptic peptides reveals active destabilisation of the IRE1LD dimer by BiP.
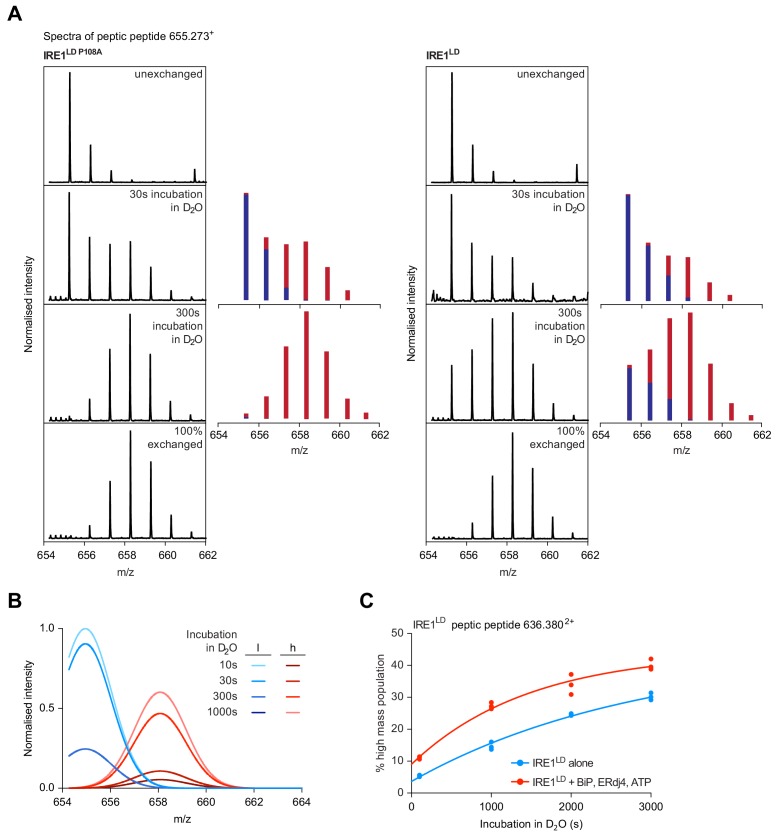
(A) Intensity distributions of the isotope clusters of peptide 655.273+ (residues 297–302) from IRE1LD, untreated or exposed to BiP, ERDj4 and ATP (30 min at 30°C) following different incubation times in D2O, as indicated. Curves are fits of the sum of two Gaussian distributions (Prism GraphPad 7.0, see Equation 4 in Materials and methods). A representative plot of three independent experiments is shown. (see: Figure 7—source data 1) (B) Plot of time-dependent change in the fractional contribution of high mass species to the isotope clusters of peptide 655.273+ (from ‘A’) calculated as described in Figure 7—figure supplement 1A and B. Shown are data points from three independent samples of IRE1LD in presence and absence of BiP, ERdj4 and ATP. The curves were fitted to a one-phase association model in Prism GraphPad 7.0. Data for a second informative peptide is shown in Figure 7—figure supplement 1C. (C) Bar diagram of the transition rate constant ktrans extracted by analysis of bimodal distributions in the isotope clusters of peptic fragments 636.3802+ and 655.273+ from IRE1LD in presence and absence of BiP, ERdj4 and ATP (from Figure 7B and Figure 7—figure supplement 1C). All the data points from three independent experiments are shown and the mean ± standard deviation (**: p<0.01, ****: p<0.0001, one-way ANOVA with Sidak’s multiple comparison test).


