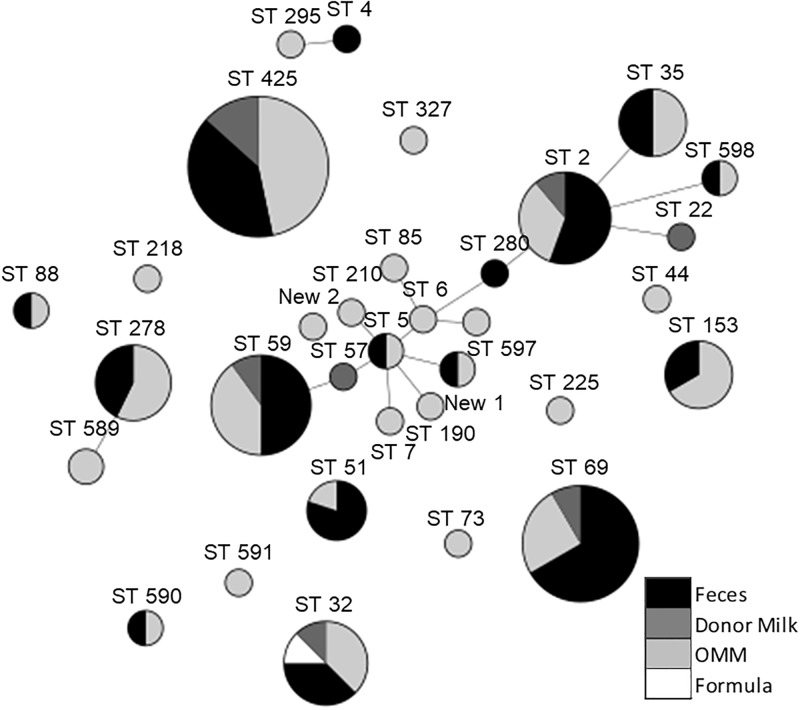
Fig 2. MLST genetic diversity using minimum spanning tree algorithm.
Each circle represents a different MLST clone; size depends on the number of isolates in the group. Clone number is indicated above circle; Circles are colored depending on the frequency of the clone in the analyzed samples: black represent frequency in feces, light grey in MOM, dark grey in donor milk and white in formula milk samples. Clones considered to be of high risk are highlighted in bold. Genetically related sequence types (STs) are connected by grey lines.

