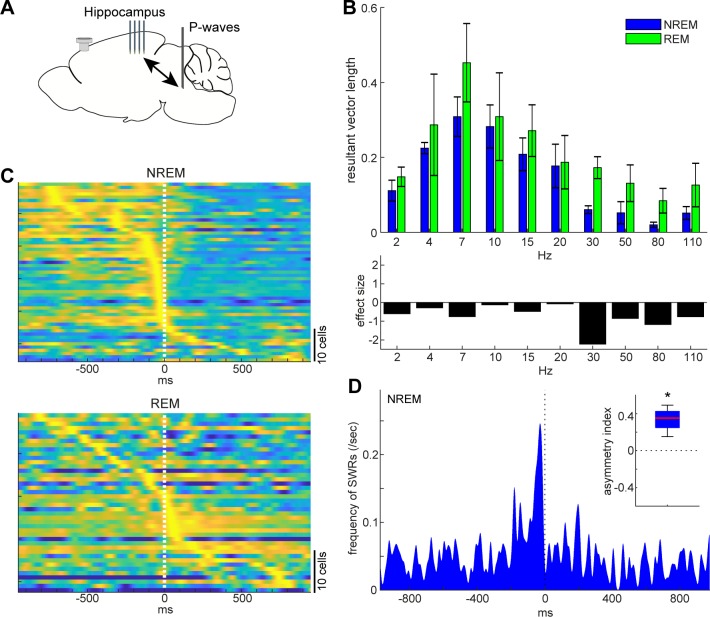
Figure 7. State-dependent interactions between P-waves and hippocampal activity.
(A) A diagram of the experimental approach showing a multi-shank silicon probe in the hippocampus CA1, a bipolar electrode in the pons and a cortical EEG electrode. (B) Phase modulations across frequency bands of hippocampal LFPs (top) and effect size of states (bottom). The effect of sleep states on resultant vector length was significant (F1,79 = 4.00, p<0.05, two-way ANOVA). Error, SEM. (C) Pooled peri-event time histograms of CA1 single units relative to P-wave timing in NREM (top) and REM sleep (bottom). Time zero is the timing of P-waves (trough time). Each peri-event time histogram is color-coded by normalizing the maximum firing rate for each cell. The order of single units was sorted by the peak timing in each state. (D) Frequency of hippocampal sharp wave-ripples (SWRs) relative to P-wave timing in NREM sleep. Time zero is the timing of P-waves (trough time). After binning at 1 ms resolution, the histogram was smoothed with a 50 ms Gaussian kernel. Inset, asymmetry index provides the normalized difference in the number of SWRs before and after P-waves in a 100 ms window. Larger positive values mean that more SWRs occurred before the P-waves. *, p<0.05 (t-test, n = 4).

