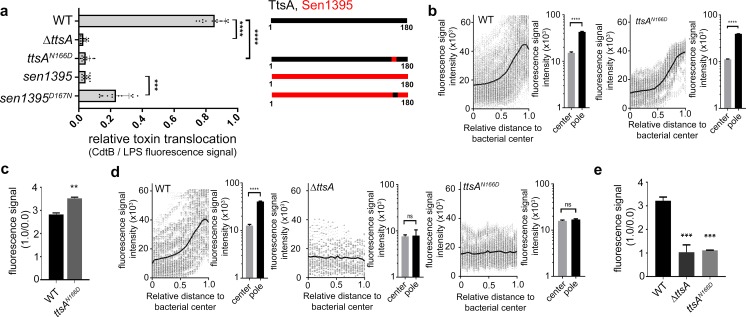
Figure 3. Polar localization and substrate recognition are mediated by different TtsA determinants.
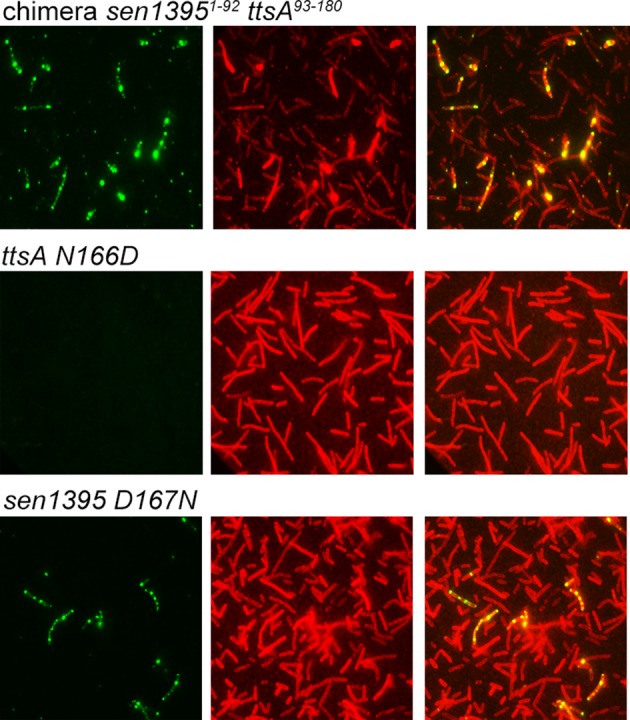
(a) Typhoid toxin translocation across the PG layer. Wild type S. Typhi, the isogenic ∆ttsA mutant, or S. Typhi strains expressing ttsAN166D, or sen1395D167N, all encoding FLAG-tagged CdtB, were grown in TTIM for 24 hr. Bacteria were then fixed, treated with Triton X-100 (0.1%) and stained with mouse anti-FLAG (to stain CdtB) (green fluorescence) and rabbit anti S. Typhi LPS (to visualize bacterial cells) (red fluorescence). The relative amount of typhoid toxin translocation across the PG was quantified by immunofluorescence microscopy after staining with antibodies to the FLAG epitope (to visualize CdtB, a component of typhoid toxin), and LPS (to visualize bacterial cells). The average ratios of typhoid toxin- and LPS-associated fluorescence intensity ± standard deviation are shown (****p<0.0001, ***p<0.001, two-sided Student`s t-Test). For each experiment a total of 10 images were collected from which 100 randomly selected bacteria per image were analyzed. A diagram of the different constructs is also shown (right panel). (b-c) TtsA subcellular localization in different S. Typhi strains. S. Typhi strains carrying chromosomally-encoded 3xFLAG-tagged wild type TtsA or TtsAN166D were grown for 24 hr in TTIM, fixed, and stained with a mouse antibody directed to the FLAG-epitope (green) (to visualize TtsA) and a rabbit antibody directed to S. Typhi LPS (red). The scatter plot shows the line scan analysis of fluorescence intensity along the axes of individual bacterial cells as described in Figure 2. The bar graphs next to each scatter plot show the average ratios of the signal intensities measured at the furthest point from the center (1.0) and at the center of each bacterium (0.0). Data represent the mean ± standard deviation from 1800 measurements (****p<0.0001, two-sided Student`s t-Test). (c) Bar graph shows the average ratios between the signal intensity of the indicated proteins measured at the point furthest from the center (1.0) and at the center of each bacterium (0.0). Data represent the mean ± standard deviation (**p<0.01, two-sided Student`s t-Test). (d-e) TtsA- and TtsAN166D-mediated PG remodeling. S. Typhi wild type, the isogenic ∆ttsA mutant or a strain expressing ttsAN166D were grown in TTIM for 24 hr and the PG was metabolically labeled with alkyne-D-alanine. Remodeling PG was subsequently revealed with azido-AF488 after its linkage to the alkyne-D-alanine that had been incorporated into the PG layer. The scatter plots show the results of line scan analyses of fluorescence signal intensities along the axes of individual bacterial cells as described above. The line depicts the average fluorescence for each measured point. The bar graphs next to the scatter plots show the average ratios of the signal intensities measured at the furthest point from the center (1.0) and at the center of each bacterium (0.0) Data represent the mean ± standard deviation (****p<0.0001, ns p=0.8464, ns p=0.8741 two-sided Student`s t-Test) (Note: the data of the ∆ttsA mutant is the same as Figure 2g and is shown here to facilitate comparison). (e) The average ratios of the signal intensities of the indicated strains measured at the furthest point from the center (1.0) and at the center of each bacterium (0.0). Data represent the mean ± standard deviation (***p<0,001, two-sided Student`s t-Test). (a–e) All data are derived from at least three independent experiments (Figure 3—source data 1).
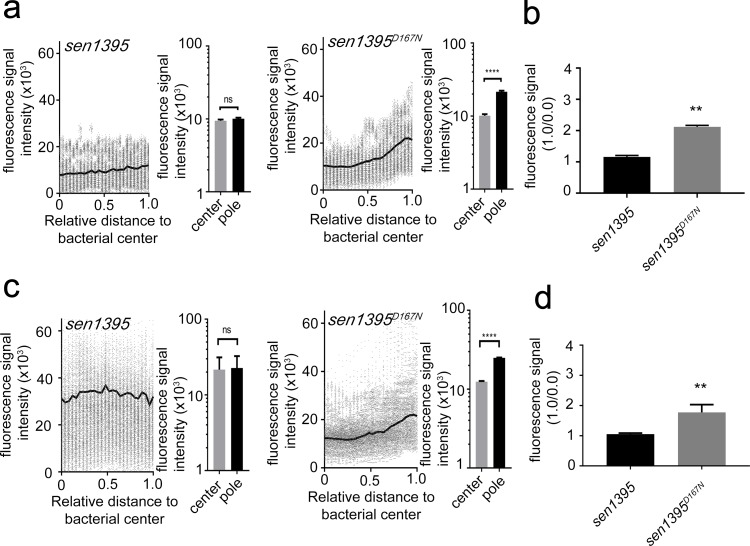
Figure 3—figure supplement 1. Ability of S. Enteritidis Sen1395-TtsA chimeric or mutant proteins to complement a S. Typhi ∆ttsA mutant strain for typhoid toxin translocation across the PG.


