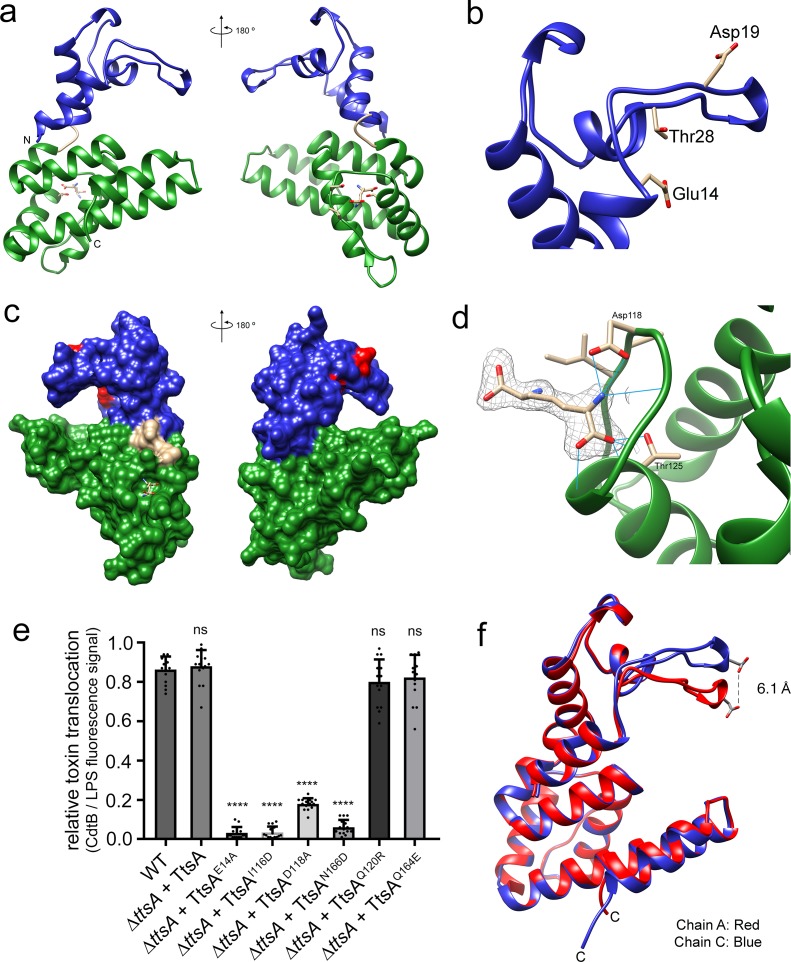
Figure 4. The atomic structure of TtsA reveals two independent domains with distinct functions.
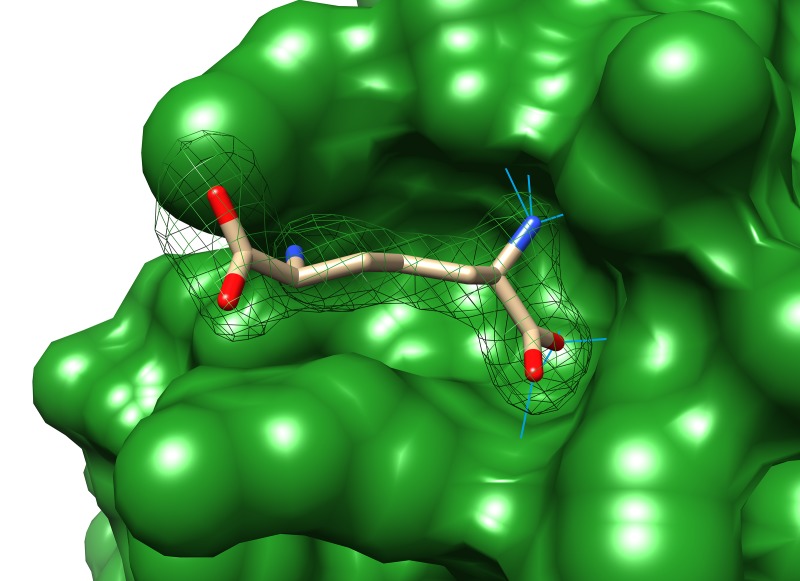
(a) Two opposite views of the overall structure of TtsA in ribbon representation. The catalytic domain is shown in blue while the substrate-binding domain is shown in green, linked by a loop (cream colored). (b) Close up view of the catalytic domain showing the lysozyme-like catalytic triad in TtsA. (c) Two opposite views of the surface rendering of TtsA. The color scheme is the same as in panel (a) with the catalytic triad colored in red. (d) Close up view of the diaminopimelic acid (API) binding pocket in the substrate-binding domain. The electron density map (2Fo-Fc, 1σ level) is shown with the modeled API (DAP) and hydrogen bonds between API (DAP) and TtsA marked by blue lines. (e) Typhoid toxin translocation across the PG layer in S. Typhi strains expressing structurally-guided TtsA mutants. S. Typhi wild type and isogenic ∆ttsA mutant strains (all expressing 3xFLAG-tagged CdtB) carrying plasmids expressing from an arabinose-inducible promoter the indicated ttsA mutants, were grown in TTIM containing 0.001% arabinose for 24 hr at 37°C. The relative amount of typhoid toxin translocation across the PG was quantified by immunofluorescence microscopy after staining with antibodies to the FLAG epitope (to visualize CdtB, a component of typhoid toxin), and LPS (to visualize bacterial cells). The average ratios of typhoid toxin- and LPS-associated fluorescence intensity ± standard deviation are shown (****p<0.0001, ns p=0.5629, p=0.0749, p=0.2450, two-sided Student`s t-Test). For each experiment a total of 10 images were collected from which 100 randomly selected bacteria per image were analyzed. Data are derived from three independent experiments (Figure 4—source data 1). (f) Comparison of the crystal structures of the TtsA chain A in red and chain C in blue, showing the conformational differences in the catalytic flap.
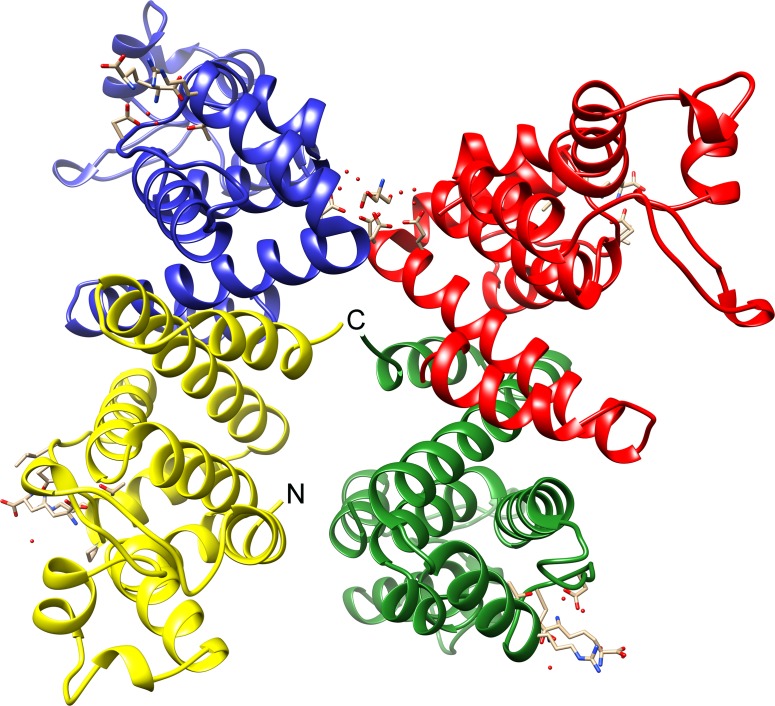
Figure 4—figure supplement 1. Overall view of the four monomers present in the asymmetric unit of the TtsA crystal.
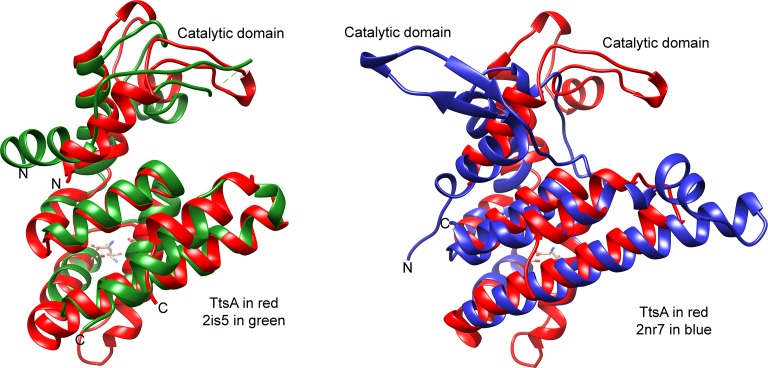
Figure 4—figure supplement 2. Structural comparison of TtsA with NMB1012 from Neisseria meningitides (PDB 2is5, left panel) and PG_0293 from Porphyromonas gingivalis (PDB 2nr7, right panel).
Figure 4—figure supplement 3. Close up of the surface rendering of the diaminopimelic (API) binding pocket.
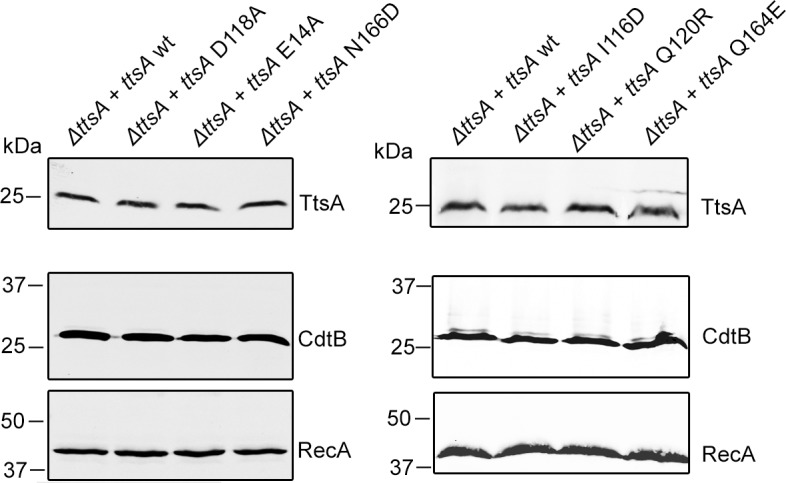
Figure 4—figure supplement 4. Western blot analysis of the expression levels of TtsA and CdtB in the indicated S. Typhi strains assayed in Figure 4E.
